10 Cost Reduction Strategies for Middle-Mile Logistics
Explore 10 cost reduction strategies for middle-mile logistics, from route planning and fuel control to maintenance, scheduling, and network design.
October 2, 2026
A route can look profitable on a dispatch board and still lose money overnight. Deadhead miles, long loading windows, engine idle time, overtime, administrative rework, equipment failures, and driver turnover can steadily consume the margin between the contracted rate and the true cost to serve. A box truck that reaches the hub on time may still have delivered a weak result if it used too many hours, carried too little freight, or required an emergency repair before the next shift.
The strongest cost reduction strategies don't chase the lowest isolated expense. They improve cost per mile while protecting service reliability, driver safety, equipment availability, and customer commitments. That requires an engineered operating system for the lane, not a list of disconnected cuts.
Start by baselining each priority route. Separate controllable costs, such as miles, fuel, labor utilization, maintenance, and dispatch effort, from costs that the operation can't immediately change. Pilot changes on high-volume overnight lanes, then review a focused set of measures, including cost per mile, loaded utilization, fuel consumption, on-time performance, overtime, exceptions, safety events, and vehicle downtime. The ten strategies below provide a practical sequence for doing that without creating operational chaos.
1. Route Optimization and Load Planning
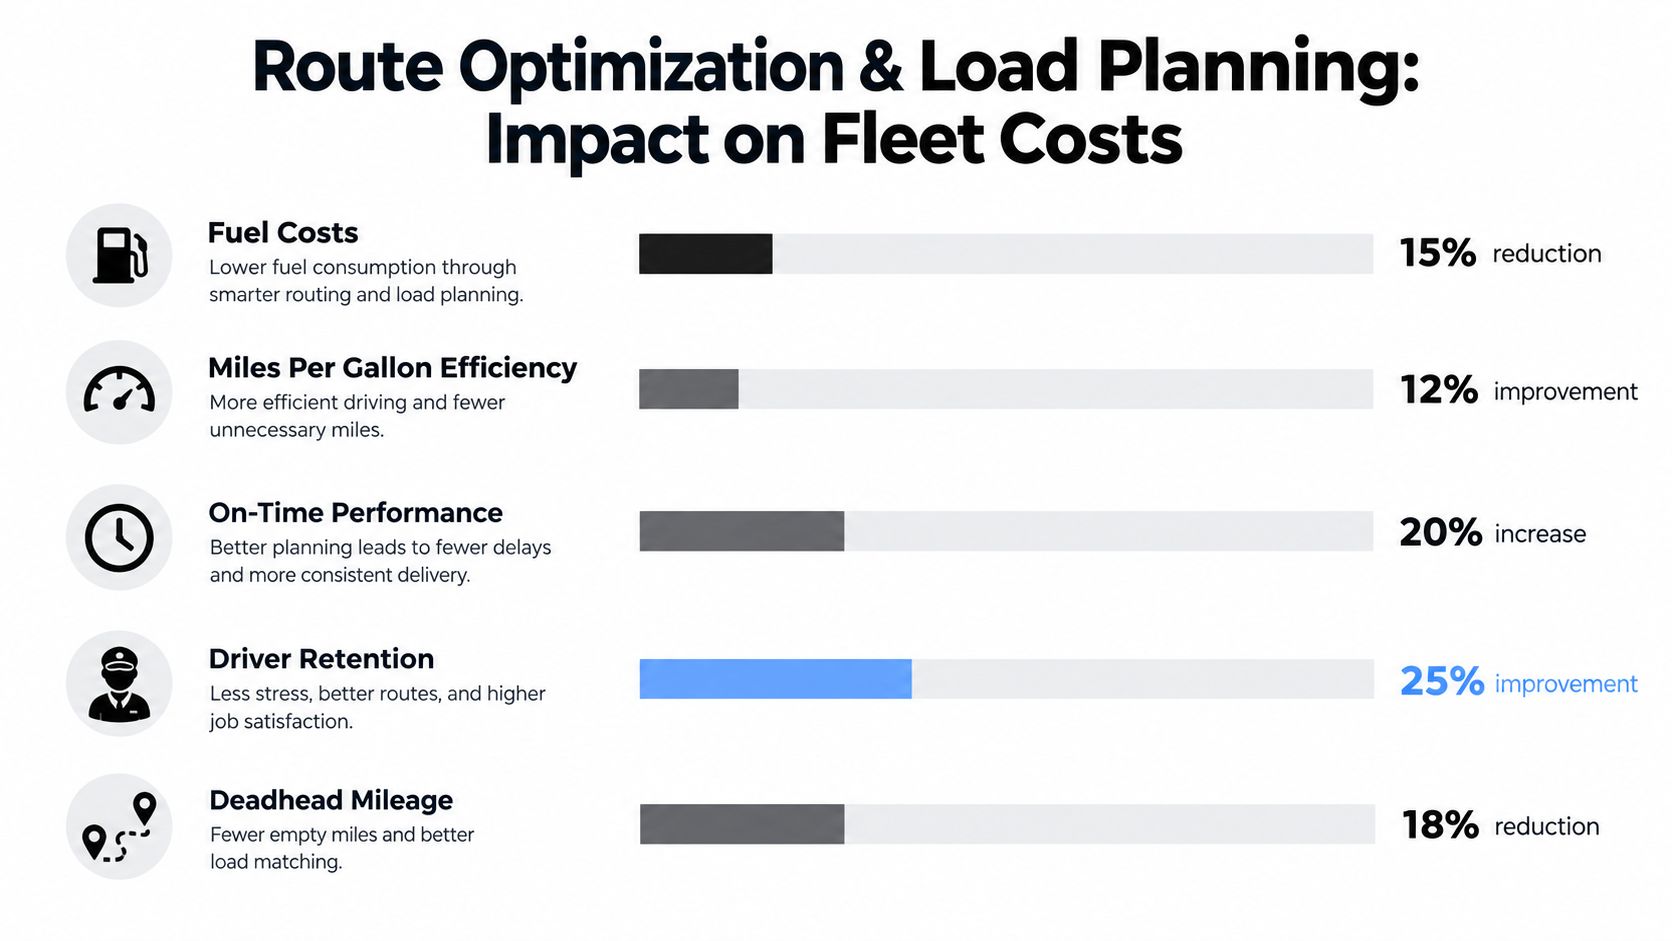
Route economics begin before the driver leaves the yard. A lane with strong revenue can underperform when the truck runs empty for part of the return, carries an unbalanced load, waits for freight that wasn't staged, or follows a delivery sequence that adds unnecessary miles. For an overnight box-truck network connecting distribution centers and regional nodes, dispatchers should examine the entire movement, not just the contracted origin and destination.
Use historical lane data, actual travel times, dock schedules, telematics, and freight dimensions to improve route and load decisions. A route-planning system can identify repeatable consolidation opportunities, while experienced drivers can flag realities that a model may miss, such as difficult dock access, recurring congestion, or a facility that routinely releases freight late. Peak Transport's approach to structured load planning is outlined in its load management systems guide.
Start with lanes you can repeat
Choose a high-volume MSP-to-regional-hub lane where the freight pattern, departure window, and receiving requirements are stable. Record the current cost per mile, empty miles, fuel use, loaded capacity, departure variance, and on-time arrival rate before changing the plan. Then test one change at a time, such as combining compatible freight, changing the sequence, or adjusting the departure window.
Practical rule: An algorithm can recommend a shorter route. A driver can tell you whether that route works at 2 a.m. in bad weather. Use both forms of knowledge.
Give drivers advance notice of route changes and explain what has changed. Review actual performance after each run, then update the plan instead of assuming the first optimization is correct. Route optimization works when it reduces wasted movement without creating missed appointments, rushed driving, unsafe loading, or extra handling.
2. Fuel Management and Vehicle Efficiency Programs
Fuel is a visible cost, but the causes of excess consumption are often distributed across dispatch, driving behavior, maintenance, and equipment selection. A truck may burn more fuel because it idles during a long dock wait, carries a poorly balanced load, follows an inefficient route, runs with underinflated tires, or has a mechanical issue that no one has connected to the fuel report.
Build a fuel program around cost per mile by vehicle and lane. Telematics can help dispatch and fleet managers identify patterns in idling, acceleration, speed, and route performance. Coaching should focus on specific behaviors and operating conditions, not on blaming drivers for every variance. Peak Transport explains related operating practices in its guide to reducing fuel consumption.
A simple operating rhythm keeps this strategy practical:
- Baseline each unit: Compare fuel cost per mile across similar trucks running similar overnight routes.
- Investigate exceptions: Look at unusual idle time, repeated fuel variance, tire issues, loading changes, and route deviations together.
- Coach with context: Discuss the trip with the driver before assigning a corrective action.
- Schedule planned work: Complete maintenance during available operating windows instead of waiting for a roadside failure.
- Evaluate replacement by total cost: Include fuel, repair frequency, downtime, utilization, and reliability rather than looking only at the purchase price.

Fuel savings disappear quickly if a coaching program encourages unsafe speeds or unrealistic schedules. The right target is efficient, repeatable driving within operating and safety requirements. Rewarding reliable habits can work better than publishing a ranking that pressures drivers to trade safety for a better number.
3. Technology and Dispatch Automation
Manual dispatch creates cost in small increments. A dispatcher calls to confirm a load, a driver texts a status update, someone re-enters a proof-of-delivery detail, and a supervisor later reconciles two versions of the same event. Each task looks minor, but the repetition consumes administrative capacity and increases the chance of a wrong address, missing document, or delayed escalation.
Start with the operational spine: dispatch assignment, driver communication, tracking, and proof of delivery. A mobile-first system should be easy to use inside the cab while parked, support clear status updates, and retain essential functions when cellular coverage is weak on rural routes. Peak Transport's dispatch system software resource is relevant to this workflow.
Automate the handoffs first
Don't begin with every available analytics feature. Configure the system around the events that create the most phone calls and rework:
- Load assignment: Give the driver one authoritative route, appointment window, and freight record.
- Status capture: Make departure, arrival, loading, delay, and delivery updates fast to record.
- Exception escalation: Route late freight, breakdowns, and access problems to the right person immediately.
- Document control: Connect signatures, photos, and delivery records to the correct movement.
- Adoption review: Track usage, missing updates, message volume, and recurring error types.
The objective isn't to make drivers interact with more software. It's to remove uncertainty from the shift. Workflow automation can also support digitised workflow solutions, but technology won't repair an unclear process. Define who owns each decision, clean up the dispatch rules, train drivers before launch, and give them a way to report friction.
A system that produces more alerts than decisions can increase cost. Keep the initial workflow narrow, measure administrative time and error rates, and add functionality only when the operation can act on the information.
4. Driver Retention and the W-2 Employment Model
A driver who knows the route, dock sequence, equipment quirks, and customer expectations contributes more than miles behind the wheel. Familiarity reduces avoidable mistakes, helps dispatch resolve exceptions faster, and supports consistent safety habits. A revolving door of drivers creates recruiting, onboarding, training, scheduling, and service costs that rarely appear in the lane rate.
A W-2 model can support that stability when the employment offer matches the work. For overnight box-truck operations, drivers may value predictable weekly schedules, paid training, health insurance options, paid sick time, retirement benefits, and a clear path to greater responsibility. The business should calculate the full replacement cost of a departure, including lost productivity and supervisor time, before deciding that a benefit is merely an expense.
Make reliability part of the employment design
Retention improves when managers address the daily causes of frustration:
- Publish the operating pattern: State the expected overnight schedule, route area, reporting process, and change policy clearly.
- Pay for capability building: Use paid training and structured ride-alongs to develop consistent operating habits.
- Create support channels: Ask drivers about loading delays, dispatch clarity, equipment condition, and schedule changes.
- Show progression: Define opportunities such as lead driver, trainer, or operations coordinator where the organization can support them.
- Review departures: Classify the reason for each exit and look for preventable patterns.
The trade-off is direct. A stable employment model carries a more visible labor commitment than ad hoc contractor coverage, but unstable labor can create hidden costs in safety, training, coverage, and customer reliability. BCG's supply-chain cost guidance supports the broader principle that labor quality and process discipline belong in total cost analysis, not outside it.
5. Compliance and Safety Program Excellence
Safety isn't a separate program that sits beside cost management. It protects the operating plan from collisions, violations, claims, vehicle downtime, missed freight, and avoidable disruption. It also affects whether experienced drivers want to stay with the company and whether customers trust the carrier with repeat overnight work.
Build the program around clear expectations and early intervention. Every driver should understand inspection requirements, hours-of-service responsibilities, cargo security, incident reporting, and escalation procedures before taking an independent route. Managers should use telematics and inspection records to identify risky patterns, then coach the underlying behavior instead of waiting for an incident.
Turn compliance into daily execution
A practical program includes documented standards, recurring audits, and feedback that drivers can act on. Review vehicle inspections, log records, training completion, incident reports, and corrective actions as operating data. If a driver repeatedly reports a defect, the answer may be a maintenance process problem rather than a driver performance problem.
Safety spending is cheaper than treating every incident as an unexpected exception.
Recognize clean execution without creating pressure to hide problems. A driver who reports a tire concern before an overnight departure has protected the lane, even if the report creates a short-term scheduling inconvenience. Partner with the insurance broker to understand claims and loss drivers, then focus training and equipment controls on the risks that affect the network.
The wrong approach is punitive metric chasing. If dispatchers pressure drivers to make up time after a late load, the operation may reduce one visible delay while increasing fatigue, speeding, or compliance risk. Cost reduction holds only when the safety system makes the reliable choice the normal choice.
6. Labor and Scheduling Efficiency
Overtime often reflects a planning failure rather than a driver failure. A route may routinely exceed its planned hours because loading time was ignored, a dock releases freight late, dispatch adds an unplanned stop, or the schedule leaves no usable buffer for traffic and weather. Treating each overtime event as an isolated payroll problem hides the design issue.
Map every overnight shift using required drive time, loading and unloading, yard movement, inspection, communication, and a realistic operating buffer. Then publish schedules early enough for drivers and dispatchers to plan around them. Predictability helps the operation control hours, and it also gives drivers a workable pattern outside of work.
Use hours-of-service tracking to flag risk before a driver is assigned the next movement. Review overtime by lane, facility, shift, and root cause. If one route produces repeated extensions, changing the start time or improving dock readiness may cost less than repeatedly paying overtime and accepting fatigue risk.
Give dispatchers rules, not improvisation
A scheduling system should define the constraints while leaving room for informed human decisions. Allow shift swaps within approved limits, maintain a qualified backup pool, and require a reason code when a planned shift changes. That creates visibility into whether the cause was demand, poor planning, equipment failure, or a customer delay.
The cheapest schedule on paper may be the most expensive schedule to operate. A tightly packed route with no recovery time can produce late arrivals, missed breaks, rushed inspections, and repeated last-minute coverage. A slightly less aggressive plan can deliver a better cost per completed movement because it protects driver hours and reduces exception work.
7. Predictive Maintenance and Fleet Health Monitoring
An overnight network has less tolerance for a vehicle that fails at the wrong time. A breakdown can require roadside service, a replacement truck, a recovery driver, customer communication, and a second attempt to move freight. The repair invoice is only one part of the event.
Use maintenance software, diagnostic information, inspection records, and driver feedback to identify failure patterns before they become roadside events. A pre-overnight inspection should cover visible tire condition, lights, fluids, warning indicators, and any defect that could affect safe operation. Drivers need a fast path to report a problem and dispatch needs a clear rule for deciding whether a truck is fit to leave.
Track maintenance cost per mile by vehicle, including parts, labor, towing, and downtime. Compare units by age, route intensity, mileage, and failure type. A truck with a lower payment can still have a higher total cost of ownership if it spends too much time in the shop or causes missed linehaul commitments.

Build a maintenance network around the lane
Use trusted repair partners near the operating area and maintain backup roadside coverage for critical routes. Schedule preventive work during predictable lower-demand windows, but don't defer a safety-critical repair to protect utilization. The short-term availability gain can become a longer outage later.
A vehicle that is available only on the dispatch report isn't truly available.
Review maintenance data during vehicle purchasing decisions. Reliability by model, parts availability, technician familiarity, and suitability for overnight loading conditions should influence the fleet plan alongside acquisition price.
8. Vendor and Supplier Consolidation
Supplier consolidation can reduce administrative effort and improve negotiating position, but it isn't automatically beneficial. A single fuel account, maintenance partner, parts source, or insurance relationship may simplify management, yet excessive dependence can leave the network exposed when that supplier lacks capacity or misses a service commitment.
Start with a spend map. Group invoices by fuel, tires, parts, repairs, roadside service, technology, insurance, and other recurring categories. Then compare price, availability, response time, billing accuracy, warranty support, and failure recovery. A low rate that produces delayed repairs or repeated billing corrections may not be the low-cost option.
Negotiate around performance
Invite qualified suppliers to respond to a clear request for proposal. Define expected turnaround, parts availability, emergency response, reporting, escalation, and billing terms before comparing rates. Volume commitments can support better terms, but only when the supplier can serve the actual geography and overnight operating pattern.
Keep backup relationships for critical services. A primary repair shop should know the fleet, but a secondary provider may be essential when the primary shop is full or closed. Conduct regular business reviews using operational evidence, not just invoice totals.
The same total-cost principle applies to outsourced support. An external provider can lower direct labor while adding coordination, quality, or compliance risk. A strategic HR management guide may help frame outsourcing decisions, but the carrier still needs to test the arrangement against its own response times, documentation requirements, and driver experience.
9. Data Analytics and Performance Benchmarking
A cost reduction program needs a measurement system small enough to use every week. More dashboards don't automatically produce better decisions. A middle-mile operator usually gets more value from a focused group of lane, labor, equipment, safety, service, and administrative measures than from a large collection of disconnected reports.
Track cost per mile, fuel performance, loaded utilization, on-time arrival, overtime, maintenance cost, vehicle downtime, safety events, exception volume, and dispatch rework. Define each metric precisely. If one manager counts a late arrival from scheduled departure and another counts it from the customer appointment, the business can't compare results reliably.
Make variance analysis the management habit
When one overnight lane costs more than another, ask what changed. Review deadhead, load factor, dock dwell, route deviation, driver hours, fuel, breakdowns, and customer requirements together. The point isn't to find a person to blame. It's to locate the process condition that produced the variance.
Digital adoption is expanding across logistics, but value depends on operational integration. McKinsey's logistics technology findings report that 54% of large shippers have implemented at least five digital use cases, while 59% expect to have ten or more within three years. The same source reports that 55% of providers expect to reach at least 13 use cases in that period, while BCG found that only 13% report measurable value from embedding AI into daily operations. Those figures point to a practical conclusion, not a reason to buy every tool. Select use cases with a named owner, a baseline, a decision rule, and a review date.
Share relevant results with drivers and operations teams. People can improve a measure they understand and can influence.
10. Network Redesign and Hub-Based Operations
Network redesign is the largest move on this list and the easiest to get wrong. Opening a satellite hub, changing relay points, or shifting consolidation patterns can reduce miles and improve density, but it also introduces rent, staffing, handling, security, technology, and management costs. The right question isn't whether a new hub looks efficient on a map. It's whether the complete cost to serve improves at the required service level.
Map customer and facility demand by geography, time window, freight type, and repeatability. Include deadhead and repositioning miles, not only loaded delivery miles. A hub that shortens the loaded leg but creates empty repositioning may weaken the network. A consolidation point that reduces trucks but adds handling can also create damage, delay, or labor costs.
Prove the economics before expanding
Model one or two high-opportunity hubs first. Use an anchor customer or established distribution center where volume and operating windows are sufficiently predictable. Measure throughput, handling time, utilization, missed connections, labor cost, facility cost, and cost per completed movement.
Lean thinking is useful here because it treats waste as a flow problem rather than a budget line. The Lean Enterprise Institute framework describes the challenge of removing unnecessary steps and redesigning flow, while a 2026 review cited in that source reported logistics cost reductions of 15% to 25% from supply-chain optimization and route or TMS improvements. The same review reported 12% to 20% reductions in cost of goods sold from lean and waste-reduction strategies. These figures shouldn't be treated as a promise for a particular box-truck network. They reinforce why operators should remove unnecessary movement, waiting, handling, and inventory before committing to a larger physical footprint.
Don't build a hub to compensate for poor dispatch discipline. Fix lane data and operating standards first, then let measured volume justify the capital.
10 Cost-Reduction Strategies Comparison
| Strategy | 🔄 Implementation complexity | 💡 Resource requirements | ⭐ Expected outcomes | 📊 Ideal use cases | ⚡ Key advantages |
|---|---|---|---|---|---|
| Route Optimization & Load Planning | Medium–High; requires algorithm integration and change management 🔄 | Route-planning software, telematics, clean historical data, driver training 💡 | ⭐⭐⭐⭐⭐ ~10–15% fuel/MPG gains; improved on-time performance | High-volume overnight lanes; regional consolidation | ⚡ Reduces deadhead, maximizes payload, improves safety |
| Fuel Management & Vehicle Efficiency Programs | Medium; telematics + behavior programs plus fleet upgrades 🔄 | Telematics, driver coaching, preventive maintenance, newer vehicles 💡 | ⭐⭐⭐⭐ Immediate 10–15% fuel savings; lower emissions | Fleets with high fuel spend (box trucks); P&L-focused cost control | ⚡ Direct P&L impact; longer vehicle life; ESG benefits |
| Technology & Dispatch Automation | Medium; integration and mobile adoption required 🔄 | Dispatch platform, mobile apps/tablets, connectivity, training 💡 | ⭐⭐⭐⭐ ~15–20% office time savings; fewer assignment errors | Operations with manual dispatch, high call volume | ⚡ Faster communication, automated PODs, reduced admin burden |
| Driver Retention & W-2 Employment Model | Medium; HR systems and benefits administration needed 🔄 | Payroll/benefits budget, training programs, HR infrastructure 💡 | ⭐⭐⭐⭐ Lower turnover ($5–8k/driver); better safety and consistency | High-turnover fleets; customer-service critical lanes | ⚡ Stable workforce, improved safety and compliance |
| Compliance & Safety Program Excellence | Medium–High; ongoing training and monitoring 🔄 | Safety trainers, telematics, compliance systems, documentation 💡 | ⭐⭐⭐⭐⭐ Reduced accidents/claims; lower insurance and fines | Contracts requiring strict safety (e.g., Amazon); high-risk operations | ⚡ Lowers insurance costs; strengthens customer trust |
| Labor & Scheduling Efficiency | Medium; requires scheduling discipline and tools 🔄 | Scheduling software, HOS tracking, planning team, communication processes 💡 | ⭐⭐⭐ Reduced overtime; improved retention and safety | Overnight/regular-shift routes needing predictability | ⚡ Maximizes productive hours; reduces payroll waste |
| Predictive Maintenance & Fleet Health Monitoring | Medium–High; sensors and predictive models required 🔄 | Diagnostic sensors, maintenance software, vendor partnerships 💡 | ⭐⭐⭐⭐ Fewer breakdowns (30–40% fewer); extended vehicle life | High-utilization fleets; operations needing overnight reliability | ⚡ Reduces emergency repairs and downtime; improves availability |
| Vendor & Supplier Consolidation | Low–Medium; negotiation and vendor management effort 🔄 | Procurement resources, consolidated accounts, SLAs, backup vendors 💡 | ⭐⭐⭐ 5–10% procurement/maintenance savings; simpler accounting | Growing fleets seeking scale leverage; centralized procurement | ⚡ Volume discounts; streamlined invoicing and vendor management |
| Data Analytics & Performance Benchmarking | High; analytics infrastructure and skilled staff 🔄 | Dashboards, data pipelines, analysts, consistent data feeds 💡 | ⭐⭐⭐⭐ Enables cost creep detection and continuous improvement | Scaling operations; pricing negotiations and ops optimization | ⚡ Objective decisions; targeted performance improvement |
| Network Redesign & Hub-Based Operations | High; capital and complex modeling required 🔄 | Network modeling tools, facility investment, partnerships, planners 💡 | ⭐⭐⭐⭐ ~10–15% cost-per-unit improvement; better density | Sufficient volume for hubs; regional consolidation needs | ⚡ Reduces miles-to-serve; improves utilization and service levels |
Build a Lower-Cost Network That Holds Up Overnight
Cost reduction works best as a controlled rollout. First, establish the baseline for each priority lane. Record route miles, deadhead, fuel, labor hours, overtime, maintenance, safety events, administrative effort, loaded utilization, and on-time performance. Include failure costs, such as breakdown recovery, rework, rush movement, and missed service, because a purchase price or linehaul rate alone won't show the true cost.
Next, pilot the changes closest to daily execution. Route optimization and load planning can expose empty miles and poor utilization. Fuel controls can connect driving behavior, idling, maintenance, and route design. Dispatch automation can reduce manual assignments, repeated calls, and documentation errors. Predictive maintenance can protect the overnight departure from avoidable equipment failures. Test these changes on priority lanes with stable volume, where the team can compare results against a clear baseline.
Review results using a limited KPI set. Cost per mile should sit beside loaded utilization, fuel use, driver hours, on-time performance, exceptions, safety measures, maintenance cost, and downtime. A lower fuel number isn't a success if the route becomes late. Lower overtime isn't a success if drivers skip inspections or dispatchers move work outside safe operating limits. Every saving needs a service, safety, and reliability check.
After the first pilots, strengthen the operating foundation. Retention, predictable scheduling, supplier terms, driver communication, and safety systems protect the gains from being erased by turnover, coverage problems, unreliable vendors, or compliance events. The labor question deserves particular care. Cutting headcount or shifting work to a cheaper labor model can create higher training, turnover, error, and service costs. McKinsey's historical cost-reduction example found that companies used a range of cost cuts after the 2008 financial crisis, but it also highlights the difference between broad cuts and targeted programs tied to functions, geographies, or operating processes. That distinction remains relevant to middle-mile networks.
Automation deserves the same discipline. Robotics is moving beyond isolated experimentation in intralogistics. A 2026 survey found that 52% of respondents already use at least one type of robot, 32% planned deployment within three years, and 58% used or were considering broader automation such as conveyors, sortation, AS/RS, or shuttle systems, according to Modern Materials Handling's robotics survey. For a box-truck operator, that doesn't mean automating an entire facility. It means examining repeatable, high-volume handling points and testing whether selective automation reduces labor or handling cost without creating new bottlenecks.
Finally, consider network redesign only when the data supports it. A hub, relay point, or consolidation center should earn its place through throughput, utilization, cost per completed movement, and dependable connections. If the volume isn't repeatable, better dispatch and load planning may produce more value than a new facility.
The objective is not the lowest possible spend in isolation. It is dependable cost per mile, protected driver hours, reliable equipment, safe execution, accurate documentation, and service performance that customers can plan around. Review the KPI set regularly, investigate variance at lane and facility level, and reinvest verified savings into maintenance capacity, driver support, training, and operational resilience. That is how a cost program becomes an operating system that holds up after the first round of cuts.
Peak Transport applies data-informed route planning, structured dispatch, modern equipment, and a safety-first W-2 employment model to overnight middle-mile operations in the Twin Cities and surrounding areas. If you're evaluating a reliable middle-mile partner or seeking a predictable box-truck driving role in Minnesota, visit Peak Transport to learn more about its lanes, services, and opportunities.