How to Improve Profit Margins in Middle-Mile Trucking
Learn how to improve profit margins in middle-mile trucking: measure lane contribution, cut empty miles and idling, and price for cost swings.
October 25, 2026

The usual advice on how to improve profit margins is to sell more, raise prices, or cut driver wages. On overnight box-truck lanes, each move has a cost: extra freight can add empty miles, detention, and overtime, while a lower wage can increase turnover and missed dock windows.
A McKinsey analysis of 17 global food-and-beverage companies from 2009 to 2013 examined how operational performance affected costs. For a trucking operation, the practical takeaway is to test whether added volume can be served without raising the cost per unit of revenue. Contract terms, driver retention, and accurate trip records also affect that cost. Start by evaluating the lane, not the company-wide P&L.
Measure Contribution Margin by Lane First
Lane contribution margin equals revenue minus driver wages and payroll burden, fuel, tolls, maintenance reserve, insurance allocation, and accessorial costs, then divided by total miles, including repositioning miles. That figure comes before any cost-cutting campaign. A route that adds sales can still reduce total margin when mileage, detention, overtime, or equipment expense grows faster than the revenue.
The McKinsey finding above isolated operational effects on cost of goods sold across manufacturing, purchasing, and supply chain. The reading for middle-mile work is direct. Grow only where the incremental freight can be served at equal or lower unit cost. Cost parity is the minimum bar for expansion, not a nice-to-have after the sales team has already sold the lane.
Build the cost lines before you rank anything
Pull 90 days of completed trips and tag each one by lane, truck, shift, and facility. Attach actual fuel invoices and maintenance postings to the truck that burned them. Allocate insurance by truck and lane exposure instead of splitting the premium evenly. Divide each lane's contribution by its total miles. Rank the three lowest by margin per truck-hour, not by revenue.
| Cost line | What to include | Common miss |
|---|---|---|
| Driver wages and payroll burden | Paid driving, loading, and waiting hours, plus benefits and payroll taxes | Counting only driving hours |
| Fuel | Actual delivered fuel cost on every mile, including repositioning | Using pump-price averages instead of invoices |
| Tolls and permits | Lane-specific tolls and route fees | Spreading them evenly across the fleet |
| Maintenance reserve | Per-mile reserve plus unplanned repair cost | Booking repairs only when invoices arrive |
| Insurance allocation | Premium share by truck and lane exposure | Splitting it evenly across all lanes |
| Accessorial and detention | Paid waiting, detention, and failed-delivery recovery | Treating them as one-off exceptions |
| Repositioning miles | Miles run without freight to reach the next load | Excluding them from the mileage base |
Practical rule: If repositioning miles are missing from the denominator, the lane looks healthier than the truck that actually ran it.
On lanes I've rebuilt, the outbound rate often looked fine and the return did not. The ranked list of leaking lanes is the only output that matters here. It feeds the empty-mile work next, and it only stays honest if dispatch records, documentation, and schedules stay stable enough to compare one month with the next.
How to Cut Empty Miles and Raise Utilization
Empty miles are a contribution-margin problem, not just a dispatch metric. MIT research on downstream networks names load consolidation, return-trip matching, and analytics-based route and schedule optimization as the primary ways to cut them. The research does not offer a universal success rate, so you measure your own before-and-after result.
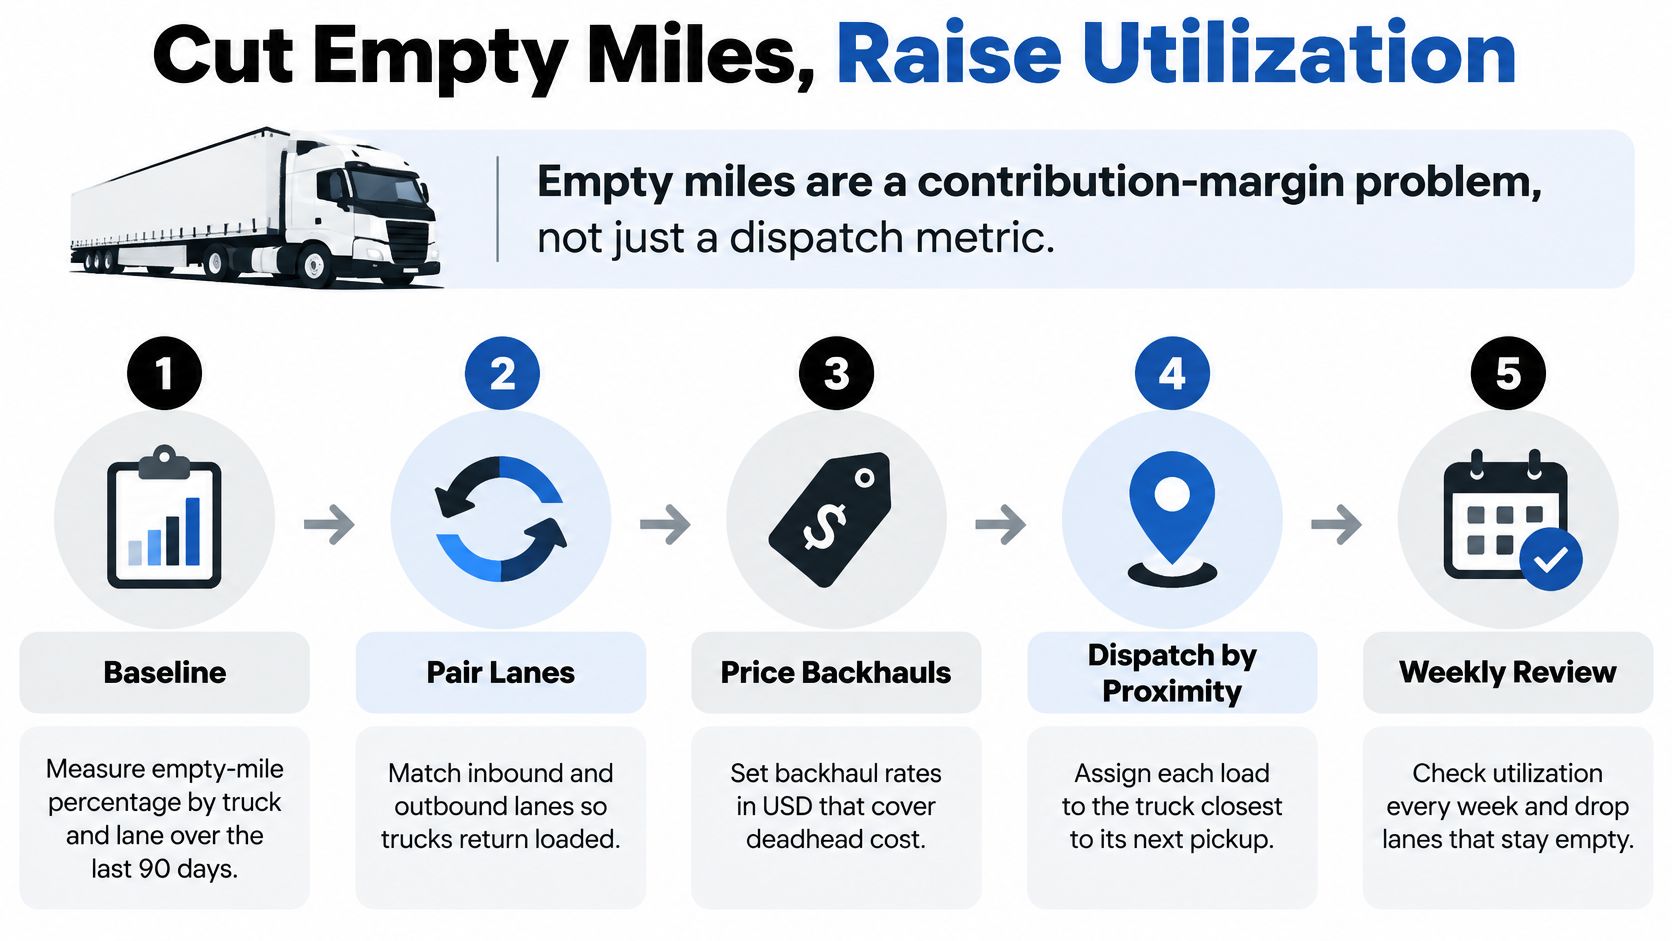
Run the five moves in order
- Baseline the leak. Measure empty-mile percentage by truck and lane over the last 90 days, and count waiting time in the same pass, because a truck sitting at a dock is not a loaded mile.
- Build the origin-destination matrix. Use completed trips, not the plan, and flag recurring delivery endpoints with weak reload density so you see the imbalance that repeats every night.
- Rank those endpoints. Sort by empty-mile percentage and gross profit per truck-hour. A busy endpoint with poor profit per hour outranks a quiet one that still covers its miles.
- Apply three fixes in sequence. Consolidate compatible freight first, match return trips second, and only then redesign route pairings and schedules from historical demand. Skipping ahead to a new schedule hides freight you could have paired.
- Test for 30 days. Set a weekly reduction target. Approve a change only when added revenue or avoided mileage exceeds the extra labor and the service risk.
A fixed overnight lane shows the pattern clearly. The truck fills outbound to a regional hub and runs near-empty back. Pairing that return with another lane's inbound freight removes the deadhead without moving the dock window. Predictable overnight schedules make the imbalance visible, and a single pairing is easier to test than a network redesign. Deeper pairing logic sits in this route optimization guide.
Three ways the metric lies
Measuring only loaded miles, ignoring waiting time, and keeping a high-revenue lane whose return repositioning destroys margin will all make a bad lane look acceptable.
Score the test on profit per dispatched hour, empty-mile percentage, on-time performance, and claims or service failures. If on-time drops or a service failure shows up, the mileage you saved wasn't free.
Cut Idle, Fuel and Maintenance Waste
Idle controls can cut waste, but a blanket rule can create safety and retention costs that exceed the fuel saved. Start with telematics and engine data. Set a baseline for idle hours and stationary fuel use, then break it down by driver, facility, route, and temperature-related exceptions. That shows where an operational fix will work and where idle time is justified.
A short walkthrough shows how stationary fuel affects route cost.
Separate necessary idle from avoidable idle
Necessary idle covers safety, extreme temperatures, and documented exceptions. Avoidable idle needs a cause-specific fix:
- Early arrival: Move the appointment or adjust departure time so the driver is not waiting at the dock with the engine on.
- Loading delays at named facilities: Use timestamps to escalate recurring holds. A facility that delays trucks every Tuesday has an operating problem, not a driver-habit problem.
- Unauthorized overnight idling: Coach the behavior. If cab comfort is driving it, consider approved cab-comfort technology instead of imposing a blanket ban.
DOE-sponsored field testing reported an average idle reduction of 13.8% on a five-truck fleet and about 2,315 gallons saved across that fleet over two years. Those are the study's reported results. Do not present a per-truck annual estimate without stating the idle hours and fuel-use assumptions behind the calculation. Convert the reported or measured gallons saved using your delivered fuel price, then subtract equipment, installation, maintenance, and training costs to calculate payback.
The break-even test is straightforward: fuel savings over the evaluation period must exceed those added costs. Include the operational trade-off, too. If a ban worsens driver comfort or retention, the resulting replacement and coverage costs belong in the calculation. Document legitimate safety exceptions, then coach repeated avoidable patterns rather than penalizing every idle event.
Price the breakdown, then decide the interval
Use 12 months of repair invoices to set a per-mile maintenance reserve. Rank failures by lane and truck, then price the full disruption: towing, replacement capacity, detention, and failed-delivery recovery. Compare that total with the cost of moving the service interval forward. A delayed repair can look cheap on an invoice and expensive on an overnight route.
Test the highest-idle route for 60 to 90 days. Review idle gallons per route, fuel cost per mile, hours-of-service exceptions, preventable incidents, and on-time delivery each week. Keep the change only if the route beats its own baseline without creating a safety, service, or staffing problem.
Price Routes for Fixed Rates and Cost Swings
A fixed rate can turn a short-lived cost increase into months of lost margin. The exposure depends on contract length, repricing delays, and the time between quoting an order and delivering it. Price fuel increases through a defined adjustment clause rather than assuming the carrier can cut fuel costs or recover them at renewal.
Reserve Bank of Australia small-business survey data covers Australian firms, not U.S. trucking companies. It found that nearly one-third of surveyed firms planned to raise average selling prices as profitability growth slowed amid tariff and inflation-related expenses. The finding illustrates how businesses respond to cost pressure, but it is not a trucking benchmark. For a carrier, the practical question is which cost risks the contract prices, caps, or leaves with the operation.

Clauses that turn variability into a priced risk
| Clause | Risk it covers | Documentation that makes it enforceable |
|---|---|---|
| Fuel escalation clause | Diesel price swings between quote and delivery | Index tied to a published diesel price, with reset dates |
| Wage escalation clause | Driver pay changes during the contract term | Annual adjustment with a stated basis |
| Detention and waiting rules | Paid dock time beyond the agreed window | Time-stamped arrival and departure logs |
| Cancellation and reschedule rules | Trucks dispatched for loads that get pulled | Notice window with a minimum charge |
| Minimum weekly volume | Lane underuse and empty repositioning | Weekly commitment matched to lane count |
| Accessorial documentation standard | Fees rejected or disputed at billing | Signed proof and photos for each event |
| Quarterly lane profitability review | Drift between contracted and actual margin | Lane P&L built with the contribution model |
Fuel and wage clauses adjust rates during the contract instead of leaving cost changes until renewal. Detention and cancellation terms set charges for paid waiting and dispatched trucks on loads that are pulled. A minimum weekly volume helps cover empty repositioning when the customer tenders less freight than agreed. Accessorial rules define the proof dispatch must capture, while a quarterly review compares actual lane results with the contracted margin. Use this freight rate management guide to structure rate terms around the costs and service conditions the lane carries.
Then test the contract against the lane P&L. Recalculate contribution margin with empty repositioning, paid waiting, maintenance reserves, and failed-delivery recovery included, using the same cost lines as the lane model. For each proposed clause, compare the expected cost it recovers with the documentation and administration required to collect it. A rate that looks profitable on the quote can lose money after service failures and unbilled accessorials. At renewal, bring documented disputes and measured cost changes to the customer, and negotiate the specific terms that caused the gap rather than asking for a blanket increase.
Staff Routes for Retention Instead of Lower Wages
A lower rate per mile can raise the cost of a completed route if it makes experienced drivers leave. Measure the wage saving against recruiting, training, coverage, service failures, and the time a replacement needs to learn the route.
ATRI's 2025 operating-cost report, as covered by Truck News, reported average U.S. truck operating costs of $2.336 per mile, driver wages and benefits of $1.028 per mile, and a 0.4% average operating margin for truckload carriers. With margins that thin, a small planning error can wipe out lane profit. Wages and benefits are a major cost line, so test any cut against the route's full replacement and service costs.
The break-even the wage cut skips
- Annual wage saving. Multiply the proposed cut per mile by the route's annual miles.
- Turnover cost per departure. Include recruiting, paid training, and short-term coverage while the route is unstaffed or assigned to a cover driver.
- Incident and service cost. Include preventable incident costs and any service penalties tied to missed windows.
- Compare per completed route. Subtract those costs from the wage saving. Cost per labor hour alone misses whether the route was completed reliably.
For example, a route running 180,000 miles a year with a 2-cent-per-mile cut saves $3,600. Assume one driver departure costs $2,000 to recruit and train a replacement, and a missed dock window adds $1,800 in coverage and service costs. That departure costs $3,800, so it exceeds the annual wage saving by $200. Replace those assumptions with your own recruiting, training, and service records before deciding.
Retention takes operating changes, not just higher pay. Publish predictable schedules, set a pay structure drivers can understand, and fix dock windows that create unpaid waits or repeated late finishes. Review whether the route's start time and handoff fit drivers' actual schedules. These changes have costs too, so track their effect against completed-route cost and service performance.
On stable overnight lanes with tight windows and costly training, a benefits-backed W-2 workforce may be worth its added labor cost if it improves retention and on-time performance enough to reduce cost per completed route.
Track schedule predictability, retention, on-time performance, and cost per completed route. Include paid non-driving time, empty miles, detention, preventable incidents, and missed handoffs in the route P&L. For more practical options, see these driver retention practices.
Track the Scorecard and Start Your 90-Day Review
A route can look cheaper on one report while losing margin elsewhere. Dispatch can raise truck use, but if that pushes drivers past legal hours or maintenance intervals, the result may be downtime, compliance exposure, or missed service. Finance, dispatch, maintenance, and safety need to review the same scorecard.
McKinsey's work on integrated cost programs makes the qualitative case for reviewing costs across functions rather than treating each one in isolation. Apply that reasoning to a trucking operation: dispatch affects mileage and driver hours, scheduling affects utilization and overtime, maintenance affects truck availability, and safety affects claims and downtime. Documentation matters too. If the records do not support the work completed, the invoice may not match the service delivered.

Nine measures, one review
| KPI | Formula | Review trigger |
|---|---|---|
| Cost per mile | Total operating cost divided by total miles | Rising two months in a row |
| Loaded-mile percentage | Loaded miles divided by total miles | Below the lane baseline |
| Revenue per truck-hour | Revenue divided by dispatched truck-hours | Falling against the prior quarter |
| On-time performance | On-time stops divided by total stops | Any lane under the agreed target |
| Detention hours per route | Paid dock waiting divided by routes run | Above the contract allowance |
| Idle gallons per route | Stationary fuel divided by routes run | Rising after a driver or facility change |
| HOS exception rate | Exceptions divided by logged driver-days | Any upward trend |
| Preventable incidents | Preventable events per 100,000 miles | Any single event on a route |
| Driver turnover | Departures divided by average headcount | Rising two quarters in a row |
Check trade-offs before crediting a change with improving margin. A rise in loaded miles is not a win if hours-of-service exceptions or maintenance downtime rise too. If payroll drops while driver turnover increases, count the recruiting, training, and coverage costs before treating the reduction as a saving. Track contract allowances and supporting dispatch records alongside operating metrics, so detention and completed work can be reconciled against the invoice.
Ninety days, one lane at a time
- Days 1 to 30: Set a baseline for each KPI by lane and truck. Calculate lane contribution using the cost lines from the initial analysis.
- Days 31 to 60: Test one idle-reduction change or empty-mile pairing on a single lane. Compare results with that lane's baseline, not the fleet average.
- Days 61 to 90: Review the pricing clauses on lanes that remain below target. Reprice or renew them at the next contract review.
Begin with the lowest-margin lane. A fleetwide target is hard to act on if nobody owns the result for a specific route. Peak Transport runs overnight lanes with data-informed route planning and structured dispatch records, which can support a baseline using trip and documentation data. Reviewing one lane in detail can show where fuel, routing, retention, contract terms, and records combine to affect contribution.