Logistics Performance Metrics for Middle-Mile
Master logistics performance metrics for middle-mile operations. Learn to track dwell time, on-time delivery, and variability to optimize box-truck routes.
October 6, 2026

The most common advice about logistics performance metrics is also the least useful for overnight middle-mile work: track on-time delivery, average transit time, cost per mile, and fleet utilization, then improve the numbers. That dashboard can look healthy while a driver waits at a congested dock, misses a handoff, and spends the rest of the night recovering a schedule created by someone else.
Middle-mile performance lives in the gaps between events. A truck can arrive on the correct date and still miss the appointment window. A route can show an acceptable average while producing unpredictable delays on enough nights to disrupt the next facility. Reliable operators measure what happened at dispatch, check-in, loading, departure, arrival, and exception closeout, then assign responsibility without turning every delay into a driver problem.
Why Average Metrics Fail Middle-Mile Operations
A single on-time percentage doesn't tell an operations director whether the truck left late, reached the yard on schedule, waited to check in, sat without a door, or departed after the appointment window had already become impossible. It records the final outcome while erasing the chain of events that produced it.
That makes average metrics dangerous in overnight box-truck networks. Distribution centers and regional hubs operate on tightly connected handoffs, so a delay at the first dock can consume the margin needed at the next one. If the dashboard only shows the final arrival, dispatch sees a late truck and the driver sees a schedule that was already broken before departure.
Practical rule: Never review an on-time result without reviewing the timestamps and exception reason behind it.
Average transit time creates the same blind spot. A lane may appear efficient because most trips are uneventful, while recurring congestion at one facility creates wide swings between the fastest and slowest runs. The average smooths away the operational pain that drivers and dock teams experience every night.
The clock must be defined before the metric
“On time” needs a declared event, a scheduled window, an allowable buffer, and a source of truth. Arrival at the property isn't necessarily arrival at the dock. A date-based measure can classify an early truck as successful even when it arrives before the facility can receive it and contributes to yard congestion.
Use separate events for:
- Pickup readiness: Was the freight available when the truck was scheduled to load?
- Facility arrival: Did the vehicle reach the receiving property within the agreed window?
- Appointment compliance: Did the driver check in and present for the scheduled appointment?
- Operational departure: Did the vehicle leave after loading, paperwork, and release?
- Handoff completion: Did the next node receive the shipment as planned?
Teams dealing with the emotional pressure of repeated disruptions may also benefit from an evidence-based self-guided therapy tool, particularly when stressful nights begin to affect decision-making and recovery. That resource doesn't replace operational controls, but personal resilience matters in a job where poor planning can put pressure on every person in the chain.
What averages conceal
A dashboard that reports only final OTD can hide facility detention, traffic, dispatch changes, documentation errors, weather, and preventable driving events inside one result. It can also punish a driver for a delay outside the cab's control, which encourages defensive reporting rather than honest exception capture.
The better question isn't “What was our on-time percentage?” It's “Which event failed, who controlled it, and what downstream handoff did it affect?” Once the team asks that question consistently, logistics performance metrics become operating controls instead of retrospective scorekeeping.
Translating Global Frameworks to Regional Routes
A global logistics index is useful only after its broad categories are tied to events a dispatcher, driver, or dock supervisor can verify. Regional box-truck operations should not copy an international ranking into the dispatch dashboard. They should use its systems thinking to expose where a route loses time, visibility, or control.
The World Bank Logistics Performance Index framework groups performance into customs-clearance efficiency, trade and transport infrastructure, ease of arranging competitively priced shipments, logistics-service competence, tracking and tracing, and timeliness. Its 1-to-5 scale rates stronger performance higher, and the 2023 edition covered 139 countries. The World Bank describes the LPI as survey-based, with respondents evaluating overseas markets across those dimensions. Its historical dataset includes editions published from 2007 through 2023.
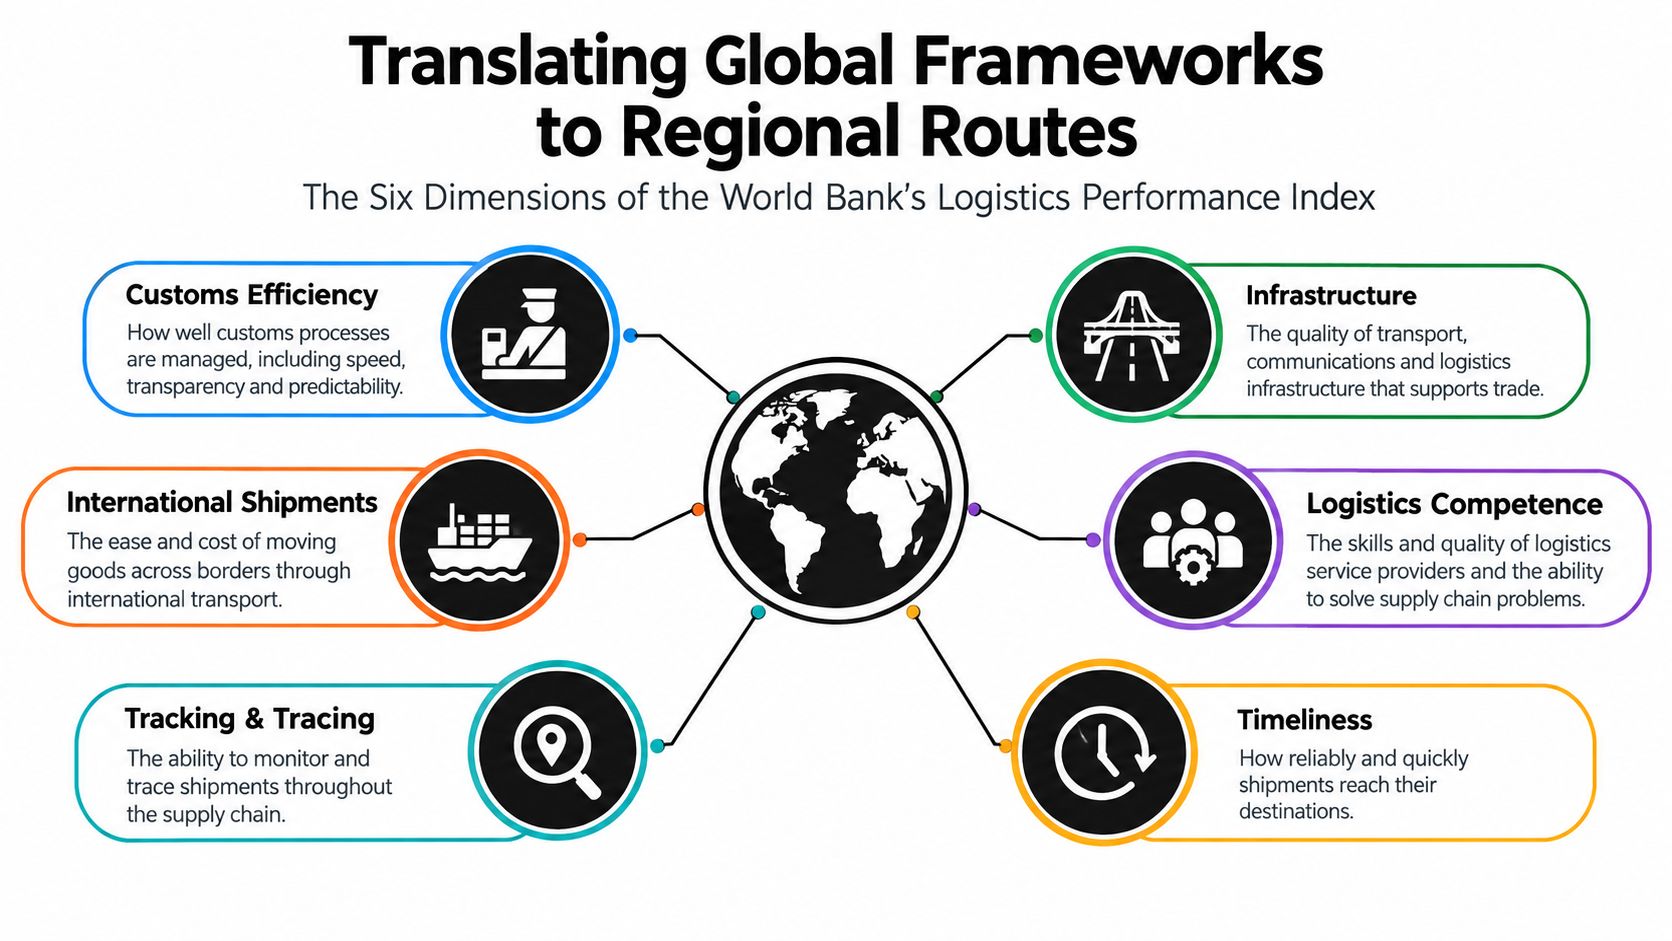
For a regional route, the categories need operational evidence rather than abstract scores. Timeliness should connect to planned departure, arrival against the facility window, appointment adherence, and completion of the next handoff. Tracking and tracing should confirm location events, check-in, release, and proof of delivery. A GPS trail without reliable check-in or release timestamps leaves the delay unresolved.
Infrastructure includes recurring gate congestion, dock availability, road restrictions, and whether the route suits the truck and load. Logistics competence appears in accurate paperwork, disciplined dispatching, driver preparation, and consistent exception handling. Shipment arrangement concerns lane design, realistic appointment planning, and capacity assignments that do not depend on constant last-minute changes. Customs efficiency has a smaller role in domestic middle-mile work, yet its lesson still applies: standardized procedures reduce avoidable friction at controlled handoffs.
Use these dimensions to connect service results with operating conditions. A route can show strong driving execution while the facility process creates poor service. Conversely, a late departure caused by dispatch planning should not be coded the same way as a receiving dock that cannot provide a door.
For each recurring lane, review the final result beside dwell, route variance, visibility, documentation accuracy, and vehicle readiness. Record the facility delay precisely, assign control to the responsible process, and bring repeated patterns into facility and network decisions. That preserves driver accountability without blaming the cab for congestion it cannot control.
Redefining On-Time Performance and Appointment Adherence
On-time performance has no meaning until the operation defines the clock. Arrival on the correct calendar date isn't the same as arriving for the agreed appointment, and arriving early isn't automatically good if the facility can't receive the truck.
A recent shipper-and-carrier KPI study found that 54% of shippers measure on-time performance against the appointment, down from 67% in 2022; among those that do, 86% provide at least some buffer, while 92% of carriers expect a buffer; 36% of shippers expect at least 96% on-time performance, although most respondents consider that requirement too demanding. These findings are reported in the shipper and carrier KPI research, and they show why a target can't be separated from its definition.
Separate the events that managers actually control
A useful scorecard doesn't force every outcome into one percentage. It records the event, the expected time, the actual time, the delay category, and the operational consequence.
| Metric event | Definition | Operational impact |
|---|---|---|
| On-time pickup | The truck reaches the origin within the agreed pickup window | Shows whether the load was available and dispatch timing was workable |
| Facility arrival | The vehicle reaches the receiving property within the scheduled window | Exposes route planning and upstream release issues |
| Appointment adherence | Check-in or dock presentation occurs according to the appointment rule | Distinguishes property arrival from usable facility access |
| On-time departure | The truck is released after loading, paperwork, and inspection | Reveals dock processing and documentation delays |
| Early-arrival rate | The truck reaches the facility before the accepted receiving window | Identifies yard congestion and schedule misalignment |
| Dwell time | Time spent between defined facility events | Shows where capacity is consumed without productive movement |
| Exception reason | A documented cause assigned to the missed or altered event | Prevents driver performance from absorbing facility or planning failures |
Every row needs a consistent timestamp source. Telematics may establish property arrival, while a gate system or driver workflow may establish check-in. If those systems disagree and the team never resolves the conflict, the metric becomes an argument rather than a control.
Report the distribution, not just the result
A late arrival should be grouped by severity, such as 0 to 15 minutes, 16 to 30 minutes, and more than 30 minutes late. That segmentation shows whether the network has small timing noise or a recurring failure that destroys the next handoff. It also exposes facilities where a broad appointment window hides repeated congestion.
Early arrivals deserve equal attention. Sending a truck too soon can create yard queues, force a driver to wait outside the operating process, or make the carrier look punctual while transferring the burden to the facility.
A target should be calibrated to the lane, facility, window strictness, and exception policy. Uniform targets produce uniform confusion.
Managers should review on-time arrival, on-time departure, appointment adherence, early arrival, dwell, and exception reason by lane, facility, time of day, and appointment type. That level of detail answers the useful question: which controllable process failure caused the missed handoff?
Measuring Route Reliability Through Dwell and Variance
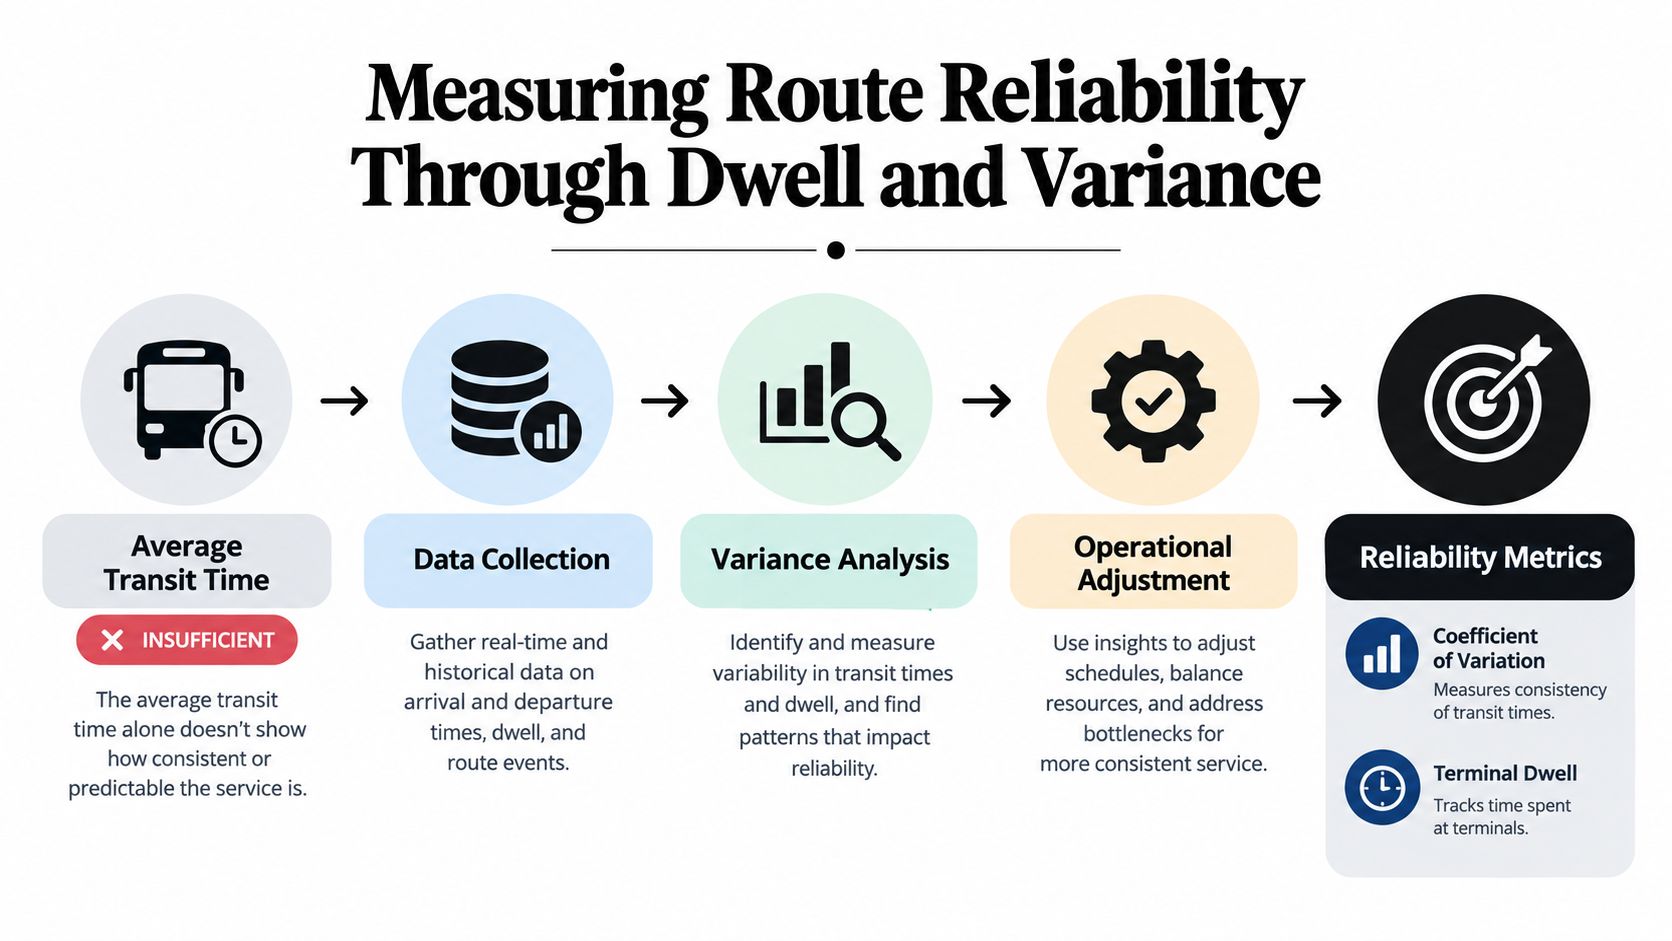
A route can meet its average transit target and still fail the operation. A 90-minute average drive may be less dependable than a 100-minute average when repeated swings consume the schedule buffer and cause missed appointments. For middle-mile box-truck operations, reliability depends on where time is lost, not just how long the trip takes. Freight performance research separates travel-time variability, terminal dwell, transfer time, delay time, and delays per ton-mile for that reason.
Build the event record before judging the route
A recurring lane needs timestamps for planned dispatch, actual dispatch, origin arrival, completed check-in, door assignment, loading start, loading completion, paperwork release, departure, receiving-property arrival, final check-in, route completion, and exception closeout. The sequence matters because each event assigns time to a process owner.
Break facility dwell into arrival to check-in, check-in to door, door to release, and release to departure. That view separates driving performance from facility-controlled waiting. A truck held at a dock for most of the night should not be scored the same way as a truck that took an inefficient route.
For each lane, compare planned and actual transit time, total route duration, facility dwell, and the coefficient of variation. The coefficient of variation allows reliability comparisons between lanes with different average travel times. Dispatch does not need the route with the lowest average. It needs a planning profile the team can trust.
Set buffers against the lane's normal pattern
Use the 50th percentile for normal planning and the 90th or 95th percentile when protecting an appointment. Compare actual results with the buffer already built into the schedule. If lane variability regularly exceeds that protection, asking drivers to increase speed treats the symptom and leaves the operating cause untouched. Review departure discipline, facility release time, route design, and appointment assumptions.
Reducing dwell and variance can protect hours-of-service capacity, improve equipment utilization, and raise on-time performance without adding vehicles. It also gives dispatch a defensible reason to change a departure time or require a revised handoff process.
Pair telematics with behavioral data and predictive insights to identify repeat patterns. Useful examples include a lane that deteriorates after a specific release delay or a facility event that repeatedly precedes a missed appointment. The purpose is operational diagnosis, not surveillance.
A practical yard management approach clarifies ownership for arrival, staging, door assignment, loading completion, and release. Without that ownership, a timestamp records delay but does not create corrective action.
Separate the events that managers control from delays caused by congestion, facility queues, or unclear appointment rules. Reliability improves when the team moves from averages to causes, then assigns each cause to the process that can change it.
Balancing Productivity Metrics with Driver Sustainability
A truck can look productive on paper while the operation is exhausting the driver and hiding facility failures. Completed loads, productive miles, stops per hour, and cost per trip still matter, but they need context from waiting time, protected driver hours, safety events, and schedule predictability. A metric that rewards only the final count can punish the person in the cab for delays created at the dock.
U.S. trucking data reported 135.9 million annual driver-hours lost to detention and 1.2 billion hours lost to congestion, while Bureau of Labor Statistics data showed truck-transportation labor productivity rising 3.9% in 2024 and total-factor productivity rising 3.3%. Those figures appear together in the 2025 trucking industry issues data. Aggregate productivity still cannot show whether gains came from better routing, less idle time, network changes, or greater pressure on drivers.
A usable scorecard connects output to the conditions behind it. Review completed loads, productive miles, stops, utilization, and cost per trip alongside hours worked, hours-of-service utilization, detention minutes, and schedule predictability. Add preventable incidents, harsh-event rates, inspection findings, and documented coaching. Empty miles, route variance, facility dwell, missed handoffs, and the source of each delay complete the operational picture.
Delay attribution should drive the response. Dispatch planning and paperwork failures belong in a corrective-action queue. A customer-caused dock wait belongs in a facility or commercial discussion. Traffic and weather may require revised planning, but they should not become a performance judgment against the driver. Event-level attribution keeps a regional box-truck operation from treating every late arrival as a driving problem.
More trips do not automatically mean better productivity. An extra trip achieved by absorbing unpaid waiting, skipping a proper break, or accepting an unrealistic schedule shifts cost into fatigue exposure, turnover risk, equipment wear, and inconsistent service. The visible output improves while the operating system becomes harder to sustain.
Overnight middle-mile routes make the trade-off sharper. A small release delay can consume the margin before the next hub appointment, and a missed handoff can pressure the rest of the shift. Managers should test whether the schedule leaves usable capacity after normal facility friction, rather than judging whether a driver can complete it under perfect conditions.
Sustainable productivity: Output counts as improvement only when the operation achieves it without converting delay, risk, or protected driver time into hidden cost.
Fatigue controls belong beside utilization reporting. A structured fatigue risk management program gives dispatch and leadership a practical way to review schedule design, warning signs, and escalation rules before a productivity target becomes a safety hazard.
Turning Telematics and Dispatch Data into Operational Action
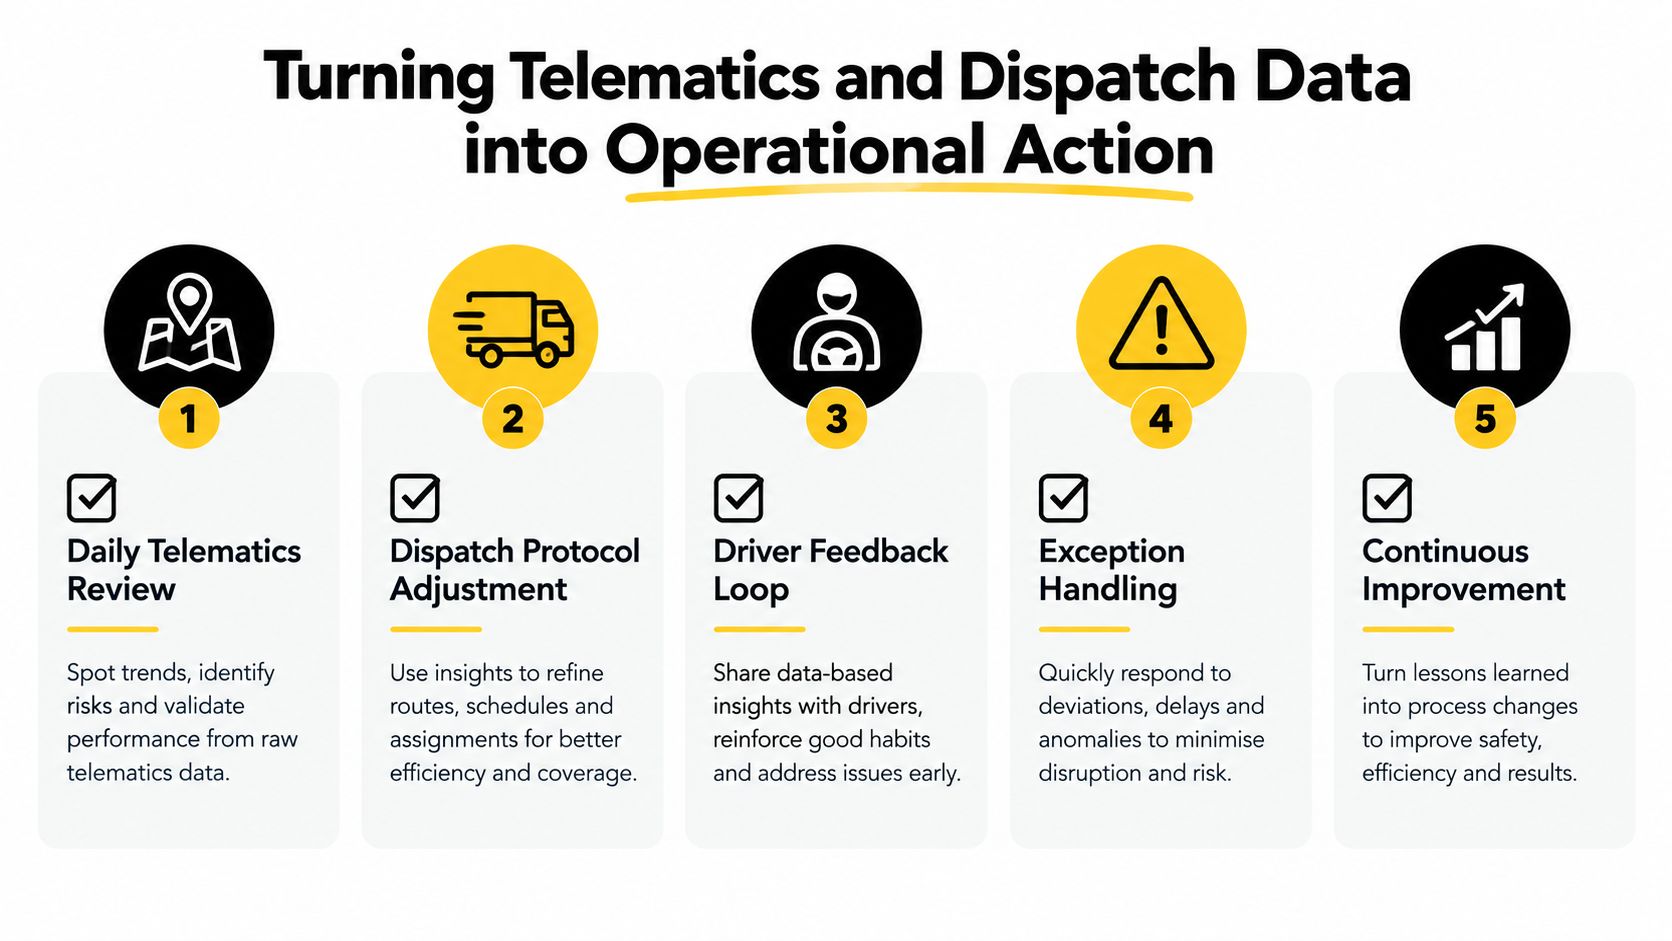
Telematics creates visibility, not improvement. Improvement starts when an operations manager defines what each event means, assigns responsibility, and changes the next dispatch decision.
Take an overnight lane with acceptable final arrival results but unreliable origin departures. The truck reaches the property on time, spends too long in check-in, and loses its appointment margin before loading starts. A driver-focused review sees a late arrival risk. An event-level review sees facility access, release timing, and loading readiness as separate issues. The response should be to verify the timestamps, identify the owner of each delay, and correct the release process, not pressure the driver to recover lost time on the road.
Make the next shift the test
A practical review begins with exceptions from the previous shift. Compare planned and actual dispatch, arrival, dwell, departure, and handoff timestamps. Then classify the cause by facility detention, traffic, dispatch error, documentation, equipment, or a driver-controlled event. Group the results by lane, node, appointment window, and time of night, so a recurring bottleneck does not disappear inside a network average.
Each review should produce one operational change. Adjust a departure assumption, correct a dispatch instruction, escalate a facility constraint, or coach a defined behavior. Record the owner and check whether the next runs changed. The scorecard should answer three questions quickly: what failed, what caused it, and what changes before the next shift?
If it cannot answer those questions, the operation is collecting data without gaining control.
Deadhead and route utilization still have value, but only with operating context. A low deadhead result may depend on late reassignment or leave an unrealistic return schedule. High utilization may look productive while facility waits consume the margin needed for the next handoff. Review the events behind the percentage before changing the lane plan.
Teams can use analysis tools from Querio to bring dispatch, telematics, and facility events into one operating view. The management process matters more than the dashboard. Dispatchers, drivers, and facility contacts need shared event definitions, reliable timestamps, and a clear correction path when records disagree.
Equipment status can create the same problem. A documented trailer tracking system helps show whether a trailer is available, positioned, released, or already committed to another handoff. That visibility prevents a missing trailer, incomplete release, or stale status from turning into a last-minute assignment failure. The goal is fewer surprises in the cab and on the dock, not another report that nobody uses.
Engineering Predictable Middle-Mile Logistics
Reliable middle-mile operations aren't built from a large dashboard. They're built from a small set of well-defined events that people trust.
Measure the appointment clock, not just the calendar date. Measure dwell in stages, not as one unexplained block. Measure route variance, not only average transit time. Pair productivity with driver hours, safety, and delay attribution so the scorecard rewards dependable execution rather than hidden strain.
The operating standard should be simple enough for a dispatcher to use during a live shift and detailed enough for leadership to identify a recurring facility problem. Every metric needs a definition, timestamp source, owner, exception policy, and action threshold. If a number never changes a route, a facility conversation, a training decision, or a staffing plan, it probably doesn't belong on the daily scorecard.
Audit the dashboard lane by lane. Remove averages that conceal event failures, separate controllable from uncontrollable delays, and establish planning buffers from observed variability. Middle-mile logistics becomes more predictable when teams stop improvising around bad data and start engineering the handoffs that drivers and facilities depend on.
Peak Transport provides structured overnight box-truck operations, clear dispatch communication, route planning, and safety-focused middle-mile execution for distribution centers and regional hubs. Visit Peak Transport to discuss dependable lane coverage or explore career opportunities for W-2 drivers in the Twin Cities area.