On Time Delivery Calculation: How to Measure OTD Rate
Learn the on time delivery calculation: the OTD formula, a worked example, how to define on-time rules and how to read the rate against benchmarks.
November 20, 2026

On time delivery is the share of shipments that land inside an agreed window, using OTD (%) = (deliveries completed on time ÷ total deliveries due) × 100. Complete 970 of 1,000 scheduled overnight middle-mile deliveries inside the customer's window and the rate is 97%.
Stopping at that divide and treating the result as a fact about the trucks misses the point. It isn't. The same week prints a different percentage when the clock that defines "on time" moves, or when failed loads disappear from the bottom of the fraction. A later timestamp, a wider day, or a denominator made only of successful deliveries can lift the figure without one extra truck making its window.
Which clock, and which list of loads, are you dividing?
The OTD Formula and a Worked Example
OTD (%) = (number of deliveries completed on time ÷ total deliveries due) × 100. On a scheduled overnight middle-mile book of 1,000 deliveries, 970 arrivals inside the customer's defined window equal 97%. That is the whole calculation. Everything else is a choice about which loads sit in each half of the fraction.
The same arithmetic scales. Use it to check a month before anyone publishes it.
| Deliveries due | Completed on time | OTD rate |
|---|---|---|
| 1,000 | 970 | 97% |
| 1,000 | 940 | 94% |
| 850 | 799 | 94% |
| 500 | 465 | 93% |
Keep every due delivery in the bottom
The denominator is every delivery due in the reporting period, not the ones that arrived. Drop the failures and the rate climbs even when service didn't. A week with 100 dues and 90 on-time loads is 90%. Remove the 10 misses from the bottom and you're dividing 90 by 90. The report now says perfect.
The formula only means something when the rules are fixed before anyone counts. "On time" might mean arrival, check-in, unloading, or the close of a receiving appointment. Early arrivals might qualify. The promised date might be the date the customer asked for, or the date the carrier confirmed. A 2019 McKinsey and Trading Partner Alliance effort found there was no universal OTIF definition, because companies differed over the time anchor, quantity level, and delivery event used for measurement. The same split sits inside a plain on time delivery calculation. Two partners can both print 97% and be scoring different events.
For operational reporting, call a shipment on time when the truck arrives at the designated facility inside the contracted window. Log facility appointment delays, weather, road closures, and shipper changes in a separate exception file. The carrier score stays readable, and delays the driver didn't cause don't change it.
Before you send the number, run three checks:
- Denominator: It equals deliveries due in the period, including misses.
- Numerator: It uses that same window rule on every row.
- Rounding: Round to one decimal and name the period, as in 97.0% for March.
Filter a dispatch export to the period, count the dues, count the rows whose facility arrival sits inside the window, divide, and multiply by 100.
OTD measures timeliness only. On-time-in-full (OTIF) also requires the full quantity. Don't set those two rates side by side as if they were the same promise.
Define What Counts as On Time Before You Count
On time against what? Four rules set the number before the first load is scored.
- Time anchor. Arrival at the designated facility, check-in, or unloading complete. A later anchor pulls dock delay into the carrier's misses.
- Early arrivals. Count them inside the window, count them late, or log them apart. The choice bites hardest on a short window.
- Promised date. Customer-requested or carrier-confirmed. Only the confirmed date is a slot the carrier accepted.
- Window width. An exact time, a 30-minute slot, or a full day. A wider window raises the rate without better service.
In 2024, 94% of surveyed supply-chain executives reported facing delivery windows of two days or less, in a Supply Chain Dive and Standvast Fulfillment survey of 151 executives. At that width, a sloppy anchor isn't a rounding error.
Our routes are scheduled runs between facilities, planned before dispatch, not random residential stops. The window exists before the truck leaves, so the arrival timestamp can be compared with it directly. Put that comparison in the service level agreement so both sides score the same event.
| Rule | Common options | Effect on the rate | Recommended setting |
|---|---|---|---|
| Time anchor | Arrival at facility; check-in; unloading complete | Later anchors add facility delays to carrier misses | Arrival at designated facility within window |
| Early arrivals | Count as on time; count as late; log separately | Matters most when windows are narrow | Count inside window and log early arrivals |
| Promised date | Customer-requested; carrier-confirmed | Requested dates can include slots the carrier never accepted | Carrier-confirmed date |
| Window width | Exact time; 30-minute slot; full day | Wider windows raise the rate without better service | Window from the booking, stated in the report |
Practical rule: Freeze the four settings in writing before the month opens. A rule invented after a bad week isn't a metric.
How to Calculate OTD Step by Step
A monthly rate is a sequence you can audit, not a single divide at month-end.
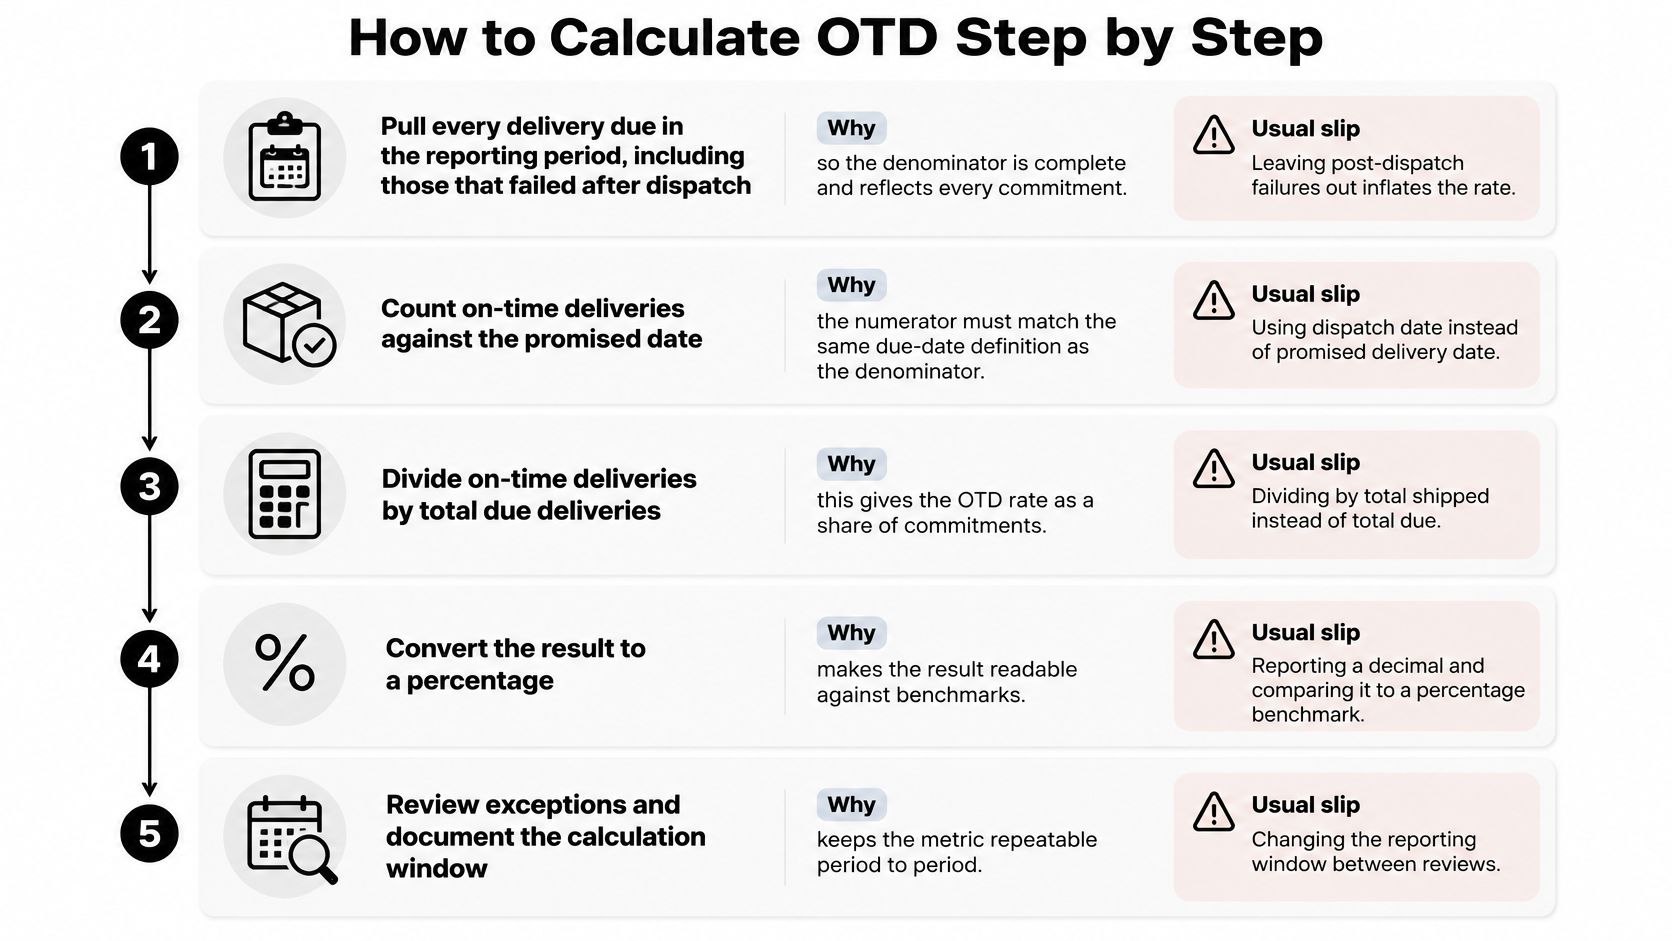
Pull every delivery due in the period, including loads that failed after dispatch. The bottom of the fraction has to match the commitments you made. Usual slip: exporting only completed loads, which makes a rough week look clean.
Attach the promised window from the booking or the schedule. Score the window that existed at dispatch. Usual slip: using a window someone widened after the truck left, with no change record on the load.
Compare the facility arrival timestamp with that window. Use the facility log and one time zone. Usual slip: mixing driver-app clocks with the dock log, so a load looks late only because the stamp is in another zone.
A status history makes that comparison faster than a Friday reconstruction. Real-time shipment tracking keeps current status and the history of carrier updates on the same shipment, so the arrival isn't rebuilt from a driver's memory.
Tag each miss as carrier-caused or as an exception. The exception list is facility appointment delay, weather, road closure, or shipper change. Usual slip: tagging a carrier miss as weather when the file has no evidence.
Count on-time deliveries as the numerator and every delivery due as the denominator. Usual slip: dividing by successful deliveries only.
Multiply by 100 and round to one decimal place. A raw 0.969 isn't comparable with a scorecard that prints percents.
Publish the rate with its period, the exception count, and a separately labeled view that shows exceptions on their own. Add one line if the window rule changed during the month. Usual slip: swapping the reporting window between reviews so this month can't be read against last month.
The same handoff is easier to brief in a short video if your coordinators would rather watch the sequence than read the checklist.
What the monthly pack should contain
One headline number. One exceptions table. One note on any rule change in the period. If any of the three is missing, the percentage isn't ready for a carrier review.
Calculating OTD in a Spreadsheet
Teams will run this on an export, one row per delivery. Use five columns: delivery ID, promised window end, facility arrival timestamp, exception tag, and on-time flag.
Compute the flag with one window rule, for example =IF(arrival<=window_end,1,0). Leave exception tags in their own column. Don't let a weather tag flip the flag. The flag answers only whether the arrival beat the window.
- Denominator:
=COUNTA(delivery_ID)so every delivery due is in the cell. - Numerator:
=SUM(on_time_flag). - Rate:
=ROUND(numerator/denominator*100,1), with the reporting period in the label.
On the 1,000-delivery book the numerator is 970, the denominator is 1,000, and the cell reads 97.0. If your sheet prints 97.5, a row was dropped or a flag used a different window.
Before you share the file, check three things. The denominator equals the deliveries due in the export. The flag column uses one window rule on every row. Every timestamp shares one time zone.
Then use COUNTIFS on lane or facility columns. A healthy headline often hides one weak dock or one overnight shift. The segment rate is the number you take into the review, not the average that buried it.
Handling Cancellations, Reschedules and Exceptions
Failures that were due stay in the count. A cancellation before dispatch leaves, because that load was never due. Everything else is a labeling problem, not a reason to shrink the list.
| Case | In denominator | Counts as on time | Handling |
|---|---|---|---|
| Carrier-caused late arrival | Yes | No | Counts against the headline rate |
| Facility appointment delay | Yes | No | Log as exception and report separately |
| Weather or road closure | Yes | No | Log as exception with evidence |
| Cancelled by shipper before dispatch | No | Not applicable | Remove from the due count |
| Rescheduled with written new window | Yes, against new window | Yes if met | Record the change date |
| Early arrival outside window | Yes | No | Apply the window rule set in advance |
Walk a month with weather in it
Say the month has 1,000 deliveries due and 40 of them are weather or a road closure. Those 40 stay in the headline denominator, and they count as not on time. Readers can still see how much of the gap sits outside the carrier's control, because the exception log names them and attaches evidence. A storm photo and a closure notice count. A note that says "weather" with nothing behind it doesn't.
Build a second figure only by removing those 40 from both the on-time count and the due count, and label it as a different metric. If none of the 40 arrived inside the window, the numerator doesn't change and the denominator falls from 1,000 to 960. That second figure is a sensitivity view. It isn't the headline, and it doesn't replace it.
Reschedules, early trucks, and shorts
A reschedule is scored on the new window only when the change was confirmed in writing before the original window passed. Record the change date. A verbal "we'll take it tomorrow" after the window has already closed is a miss against the original promise.
An early arrival follows the rule you froze earlier. If on time means inside the window, a truck that shows up 90 minutes early is a miss, and you still log it so the dock team can see the pattern.
A partial delivery counts as one unit unless the agreement counts lines or pallets. Say which unit the report uses. Mixing shipments and cartons in one month makes the percentage unreadable.
Never remove a delivery from the denominator just because it failed. This is not optional. The miss belongs in the headline, and the reason belongs in the exception log.
Reading the Rate Against Benchmarks and Trends
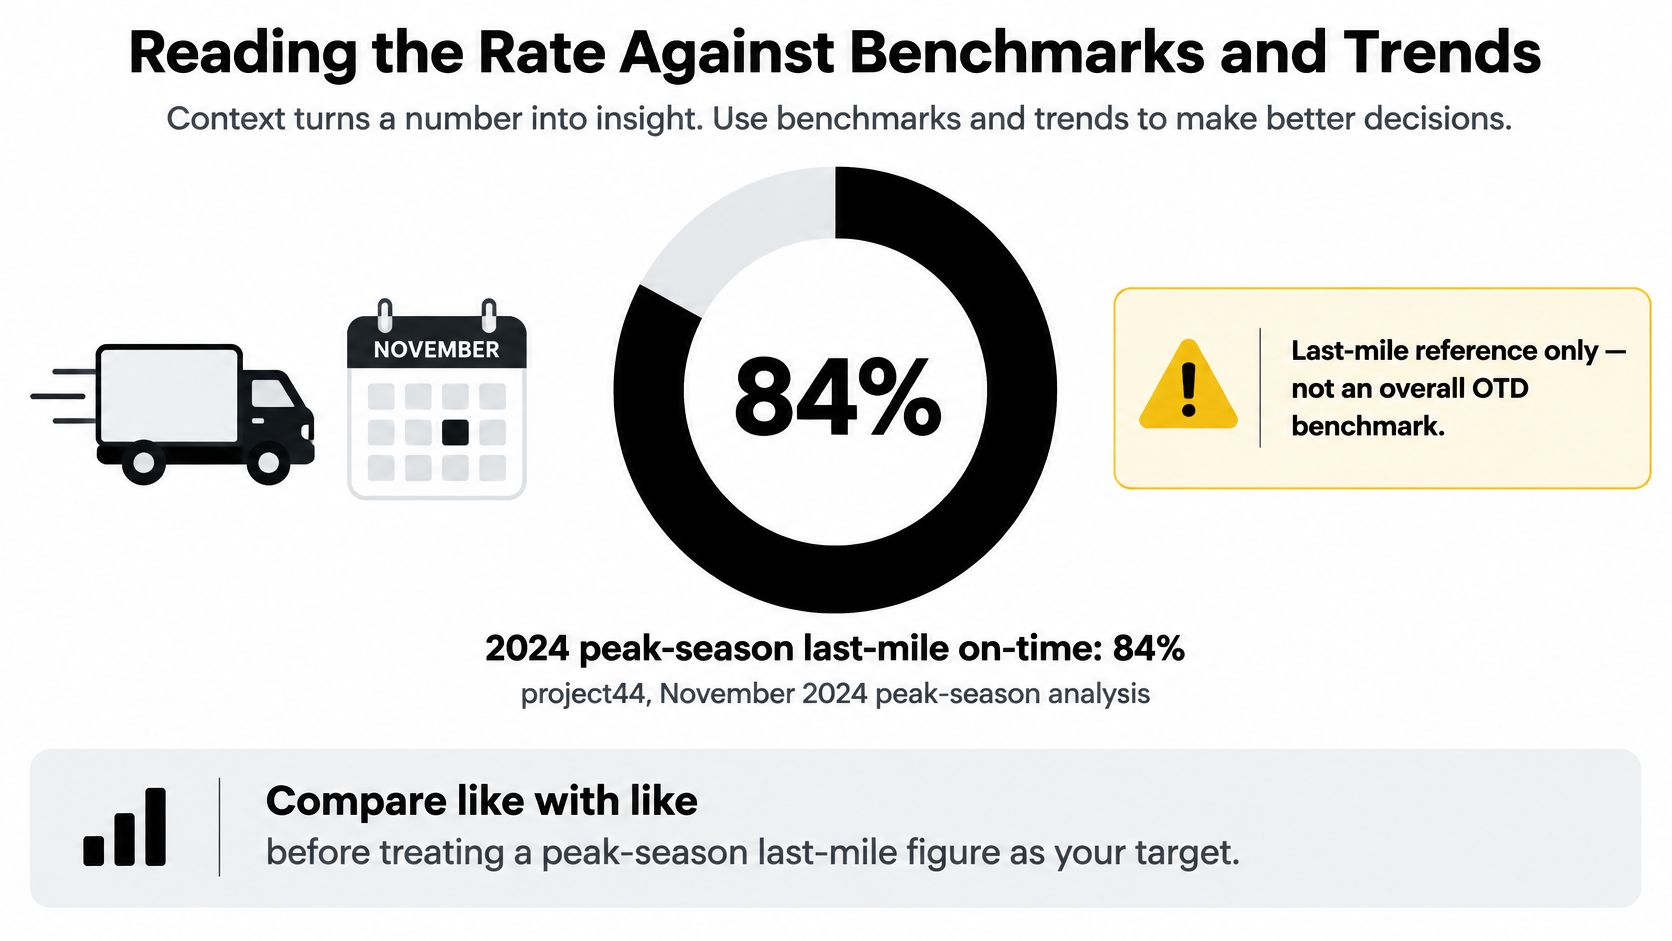
In 2024, 84% of last-mile deliveries were on time during November, the figure project44 published in its peak-season analysis. That is a last-mile, peak-month reference. It isn't an overnight middle-mile target, and treating it as one will make a planned facility lane look worse than the work it does.
At 1,000 deliveries, each percentage point is 10 trucks. Moving from 97% to 94% is 30 more late arrivals. That gap deserves a root-cause pass, not a shrug. A single month with only 80 deliveries can swing hard on one bad night, so read a rolling three-month average beside the monthly print.
Segment by lane, shift, facility, and customer. One weak dock can sit inside a healthy average and never show up in the headline. Brands comparing partners should confirm that each partner used the same rules. A partner's 95% and your 95% can measure different clocks. FBA sellers who already watch seller-central clocks can line those clocks up with the middle-mile arrival rule in the agentcentral operating view for FBA sellers. The same like-for-like test belongs in any performance benchmarking review you run with a carrier.
A number without its rules and its sample size tells you very little. Ask for both before you rank anyone.
Write Your OTD Rules Down Before the First Count
Don't open the first month until the rules exist on one page.
- Write the sheet. Cover the time anchor, the early-arrival rule, the source of the promised date, the window width, the exception categories, and the reporting period. One page is enough. A policy no coordinator can find won't be applied.
- Share it before the count. Send it to every carrier and every internal team that will touch the file. Scoring starts only after they have it.
- Ask each partner for three things. Its written definition, the raw arrival timestamps for a sample month, and its exception log. Recalculate the rate yourself. If the numbers don't match, the rules differ, not the arithmetic.
- Run a one-lane pilot for one month. Compare your result with the partner's figure. Use the rate in a contract only after the two match.
Drivers and compliance coordinators can use the same sheet to see how their own routes are logged. If a sample month won't reconcile, call the office at 612-230-1292 and walk the timestamps against the written rules.
What you should hold at the end is small. One agreed formula, one agreed rule set, and one number you trust because you can rebuild it.
Peak Transport runs scheduled overnight middle-mile box-truck routes between distribution centers and hubs across the Twin Cities, with the delivery window set before dispatch so on-time performance can be audited against a real arrival. If you want that kind of middle-mile execution on your lanes, visit Peak Transport and tell us which facilities you need connected.