Route to Market Model: A Guide for Logistics Managers
Learn to design and optimize a route to market model for regional distribution. This guide covers direct, indirect, and hybrid strategies for success.
September 22, 2026
A growing business can have full trucks, busy docks, and plenty of customer demand, yet still lose money on distribution. Orders leave at inconsistent times, drivers wait for paperwork, fuel consumption rises, and customers hear different delivery promises depending on who answers the phone. In a Twin Cities operation, overnight box-truck work adds another layer of pressure, including limited dock windows, tight driver hours, weather exposure, and the need to move freight between major facilities without creating morning congestion.
That situation usually isn't caused by one bad route. It reflects a distribution network that developed without a clear commercial and operating design. A route to market model gives logistics managers a way to connect channel decisions, partner responsibilities, delivery frequency, inventory ownership, and field execution. It turns distribution from a collection of urgent decisions into an operating system that can scale with demand.
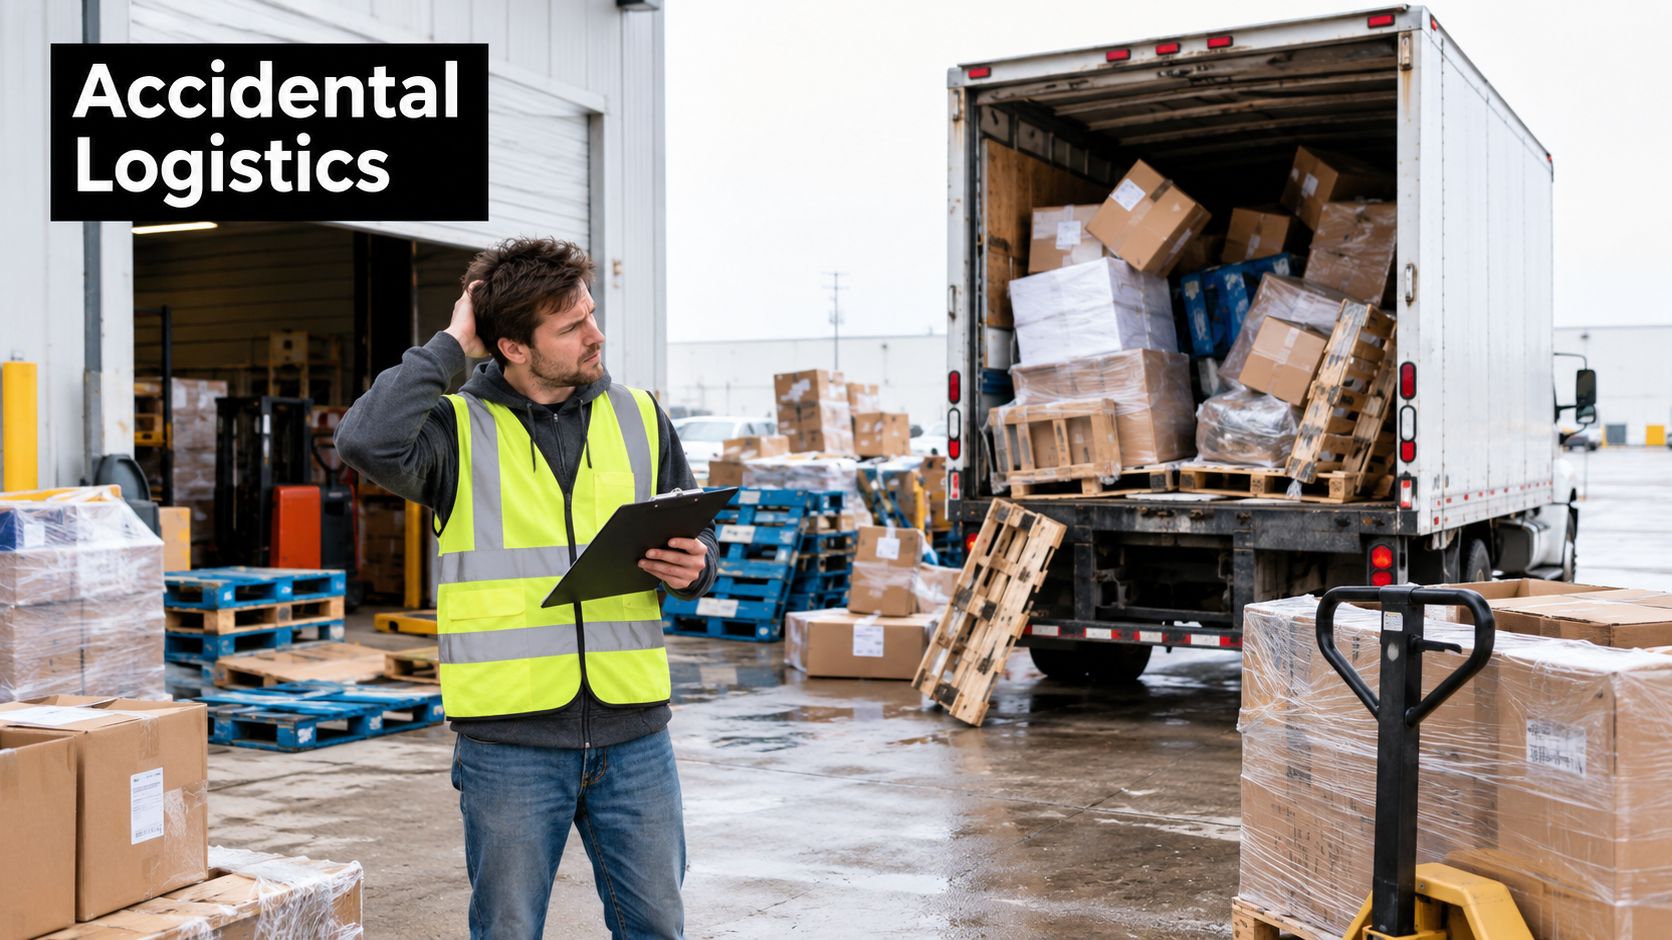
Moving Beyond Accidental Logistics
A Twin Cities box-truck operator can start the night with a full dispatch board and still lose money by morning. A retailer changes its delivery window, a distributor asks for smaller drops, and an e-commerce customer adds another fulfillment location. Dispatch responds with an extra run, a later departure, or any carrier with available capacity. That keeps freight moving, but it does not create a dependable network.
As volume grows, the operating trade-offs become visible. Warehouse release waves may miss carrier cutoffs. A truck may leave partly empty to protect a service promise, while another waits for freight arriving late from a regional distribution center. Customer service records missed appointments, and finance sees fuel, labor, and accessorial costs rising without a clear cause. The overnight schedule exposes every weak handoff, especially across regional lanes that must reach morning docks on time.
The correction begins by separating commercial design from route-by-route decisions. A route to market model defines how goods move from the factory gate to the shopper's basket, including the roles of sales channels, distributors, warehouses, and carriers. Academic research describes how these models became more formal as companies developed distribution and sales coverage, then adjusted to omnichannel operations. The academic discussion of route-to-market development places RTM between commercial planning and logistics management.
The practical shift
An intentional model establishes operating rules:
- Which customers receive direct service?
- Which outlets should be served through a distributor?
- Who owns the customer relationship?
- How often should each location receive a delivery?
- Who owns inventory during each transfer?
- Which freight moves overnight, and which moves during the day?
- What service level justifies the cost of a lane?
These choices give dispatch a stable framework. They also help operations leaders challenge requests that add stops, handling, or empty capacity without improving the customer promise. A practical overview of what logistics management covers helps connect those commercial decisions with transportation, warehousing, and delivery execution.
Practical rule: If the team cannot explain why a lane exists, which customers it serves, and what service promise it supports, the network likely grew by accident.
A route to market model will not remove complexity. It makes the cost and ownership of that complexity visible, then gives managers a repeatable way to decide whether a route, partner, or service promise still fits the regional distribution strategy.
Understanding the Core Route to Market Models
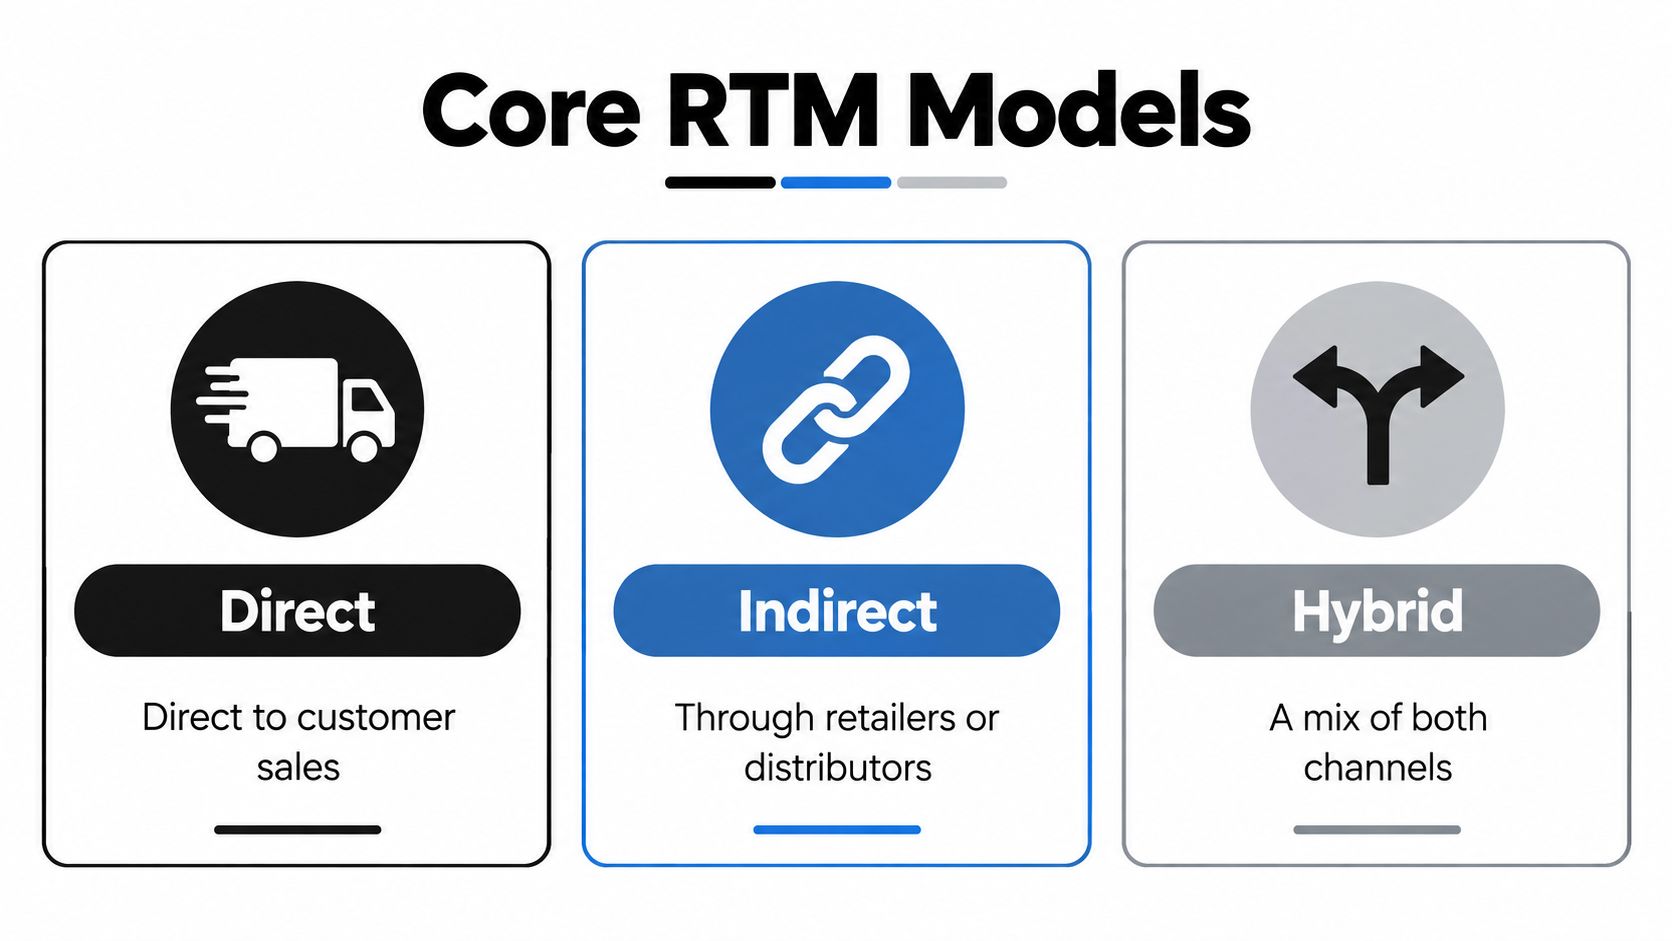
A Minnesota box-truck operator can see the difference on a single overnight run. A manufacturer delivering directly to a named customer owns the stop, the service promise, and the exception. A shipment moving through a distributor adds an intermediary that may consolidate freight, hold inventory, and manage local delivery. Serving both paths creates a hybrid model.
The same operating logic applies to manufactured goods, consumer products, and regional freight.
Direct distribution
In a direct route to market model, the manufacturer or brand sells to and serves the customer without an intermediary controlling the transaction. The company may use its own sales team, fulfillment operation, delivery fleet, or contracted transportation partners, while retaining the primary customer relationship.
Direct service provides greater control over pricing, customer experience, delivery commitments, and demand information. It fits concentrated customer bases, predictable orders, and products that require close account management. The trade-off is responsibility for sales coverage, order processing, inventory placement, transportation, exception handling, and customer support.
For a box-truck operation serving a major metro area, direct distribution also puts stop density and delivery windows under the brand's control. That can support a strong customer promise, but scattered accounts and frequent small deliveries raise route cost quickly. The brand owns the relationship and absorbs the cost of each stop.
Indirect distribution
An indirect model uses intermediaries such as distributors, wholesalers, retailers, or other channel partners. The manufacturer generally moves larger quantities into partner facilities, while the intermediary handles some combination of local selling, inventory holding, order capture, and final delivery.
This structure expands market access without requiring the manufacturer to operate every local route. It can support denser transfers into distribution centers and regional hubs, which may suit overnight middle-mile capacity better than repeated direct stops. The manufacturer gives up some control over downstream visibility, pricing execution, outlet coverage, and customer interaction. Limited partner data can also obscure what sells after the initial shipment leaves the manufacturer's warehouse.
Hybrid distribution
A hybrid route to market model combines direct and indirect paths. A brand may serve strategic national accounts directly, use distributors for fragmented independent outlets, and fulfill e-commerce orders through a regional network. The design matches service intensity with customer value and the practical limits of the operating network.
The main risk is inconsistent governance. Sales teams can promise different service levels, inventory can be allocated without regard to channel economics, and transportation planners can inherit incompatible schedules. A workable hybrid model sets rules for account ownership, pricing, inventory allocation, delivery frequency, data sharing, and escalation.
A business may need several routes rather than one model across every customer. In consumer packaged goods, an average category typically has 5 to 15 different RTM routes, while 2 to 4 routes often account for up to 70% of category sales, according to academic research on route-to-market structures. That concentration supports segmentation. A Twin Cities operator might reserve direct overnight service for dense, high-priority accounts, while using partner distribution for broader but less frequent coverage.
| Model | Main strength | Main trade-off |
|---|---|---|
| Direct | Control over customer experience and data | Greater operating responsibility |
| Indirect | Broader reach through established partners | Less downstream visibility and control |
| Hybrid | Flexible service by customer or channel | More complex governance and planning |
The right choice depends on customer density, order characteristics, service requirements, working capital, partner capability, and the cost of moving freight through each path. A route that looks efficient in a commercial plan still has to work at the dock, on the overnight linehaul, and at the customer's receiving window.
Why Your RTM Model Lives and Dies in the Middle Mile
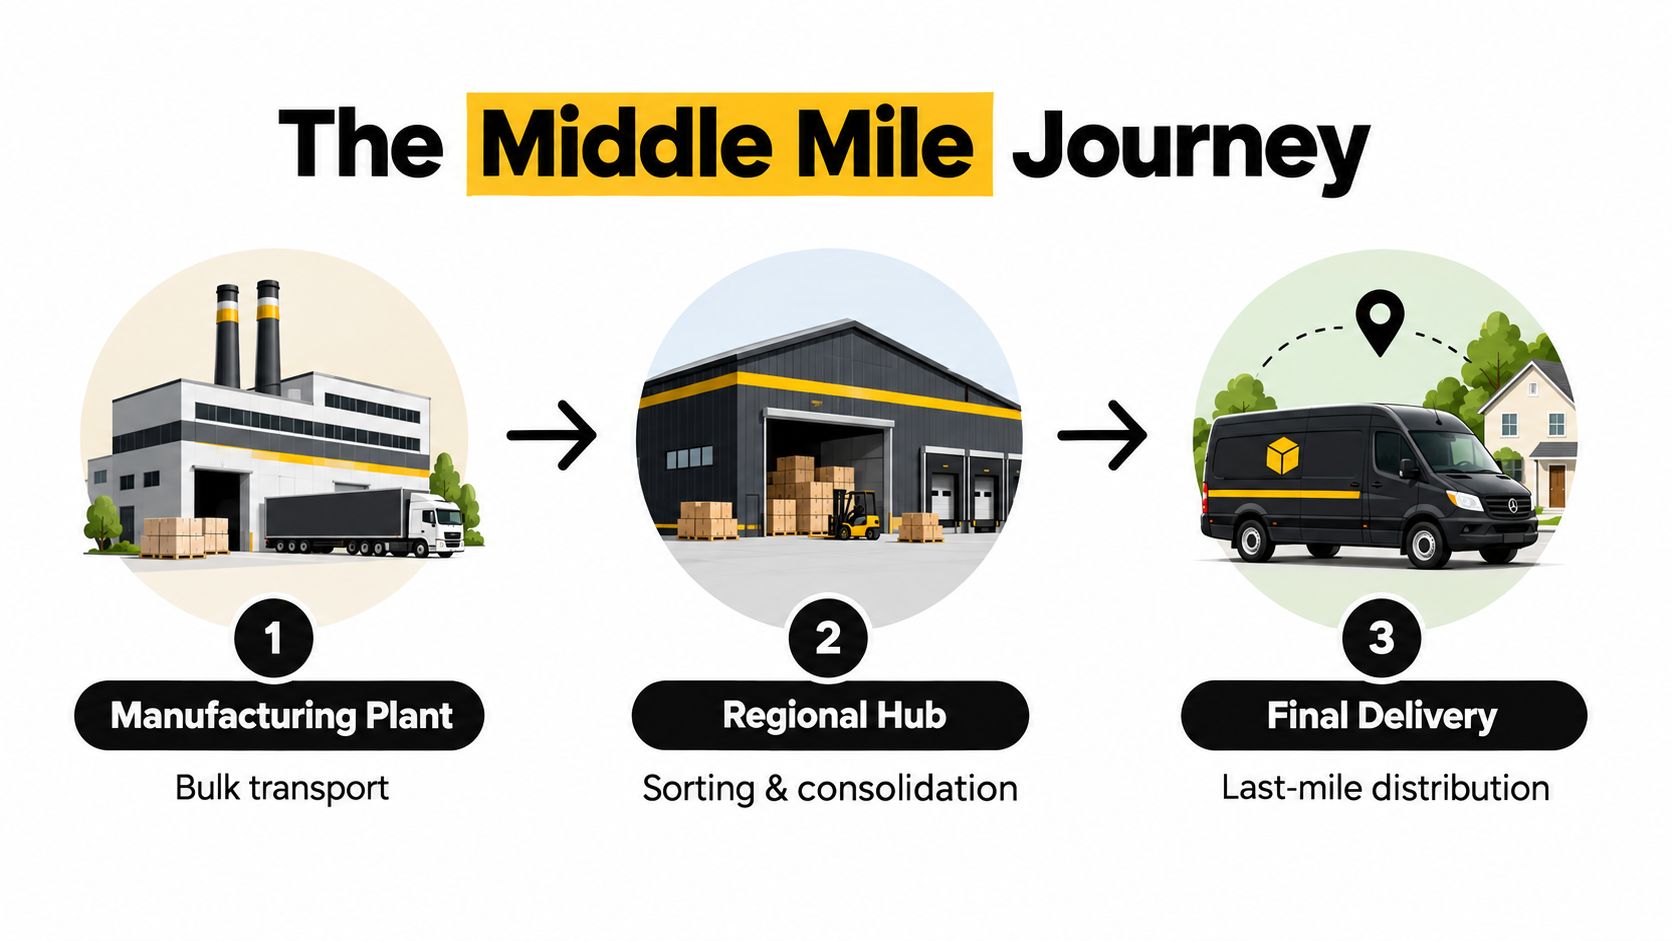
A route to market model becomes real when freight starts moving. The middle mile connects manufacturing sites, central distribution centers, regional hubs, fulfillment facilities, and local delivery operations. It may not be visible to the end customer, but it determines whether inventory reaches the right node in time for the promised service.
A direct model can require frequent, smaller movements toward local fulfillment points or sortation facilities. An indirect model may rely on scheduled bulk transfers from a manufacturer to a retailer or distributor distribution center. A hybrid model often needs both, with different cutoff times, trailer or box-truck requirements, handling rules, and data expectations.
The underlying principle is broader than transportation. An RTM model links manufacturing, logistics, and field execution. It defines choices such as intermediaries, visit frequency, and delivery ownership, all of which affect reach, availability, and cost-to-serve in complex retail environments, as described in this route-to-market operating framework.
What changes at the dock
For a Twin Cities middle-mile operation, the model affects practical details:
- Release timing: Freight must leave the origin when the receiving facility can process it, not only when it's ready.
- Consolidation logic: Orders for several destinations may need sorting before departure, while time-sensitive lanes may justify a dedicated run.
- Vehicle selection: A box truck can support recurring regional movements, but the load profile, dock access, and delivery requirements still determine whether it fits.
- Driver planning: Overnight schedules require realistic drive time, loading time, facility dwell, breaks, and safe return windows.
- Exception control: A late trailer, incomplete manifest, or closed dock can disrupt the next morning's fulfillment cycle.
The carrier relationship should reflect the chosen channel. An indirect route with regular palletized transfers needs dependable lane coverage and disciplined appointment execution. A direct or hybrid network may need more flexible sequencing, tighter scan visibility, and coordination across multiple fulfillment nodes.
Operations leaders should also treat insurance and compliance as part of partner qualification, not as paperwork added after a lane launches. Teams comparing coverage requirements can browse auto transport insurance plans while defining the risk controls expected from transportation providers.
A useful visual explanation of the handoff between regional nodes appears in this guide to middle-mile logistics.
The middle mile exposes weak RTM decisions quickly. If the commercial team promises dense coverage but the network can't consolidate freight, transportation absorbs the penalty. If the company uses an intermediary but lacks secondary-sales visibility, replenishment decisions become reactive. The model and the physical network must be designed together.
How to Design Your Regional Distribution Strategy
Regional design should start with customer requirements, then move through economics and operating controls. Logistics managers often begin with available trucks or warehouse locations because those inputs are familiar. That approach can lock the business into a network that serves existing constraints instead of business priorities.
A practical RTM design separates channel segmentation, partner architecture, and service model. It also defines order cadence, delivery frequency, ownership of inventory and freight risk, and the data that must flow between parties. This RTM design framework describes those elements as a control system, not merely a route planning exercise.
Start with channel selection
Map customers by service need, not only by geography. A nearby account may require appointment delivery, pallet exchange, or strict receiving documentation. A farther account may accept consolidated freight on a fixed overnight schedule. Distance alone doesn't determine route suitability.
Create a channel profile for each major customer group. Include order size, order frequency, delivery window, product sensitivity, receiving requirements, return flow, and the level of visibility the customer expects. Then identify which accounts deserve direct attention and which can be served through a distributor or shared regional network.
In the Twin Cities, the practical question is often whether a recurring lane can connect a distribution center, regional hub, or Amazon Relay node without forcing drivers into avoidable deadhead or excessive dwell. The answer should come from lane data and facility behavior, not from a generic promise of next-day service.
Model cost to serve
Cost-to-serve analysis should include more than the carrier invoice. Build the full cost picture around:
- Linehaul and fuel: Include planned mileage, expected empty movement, tolls where applicable, and fuel exposure.
- Labor and uptime: Account for loading, waiting, paperwork, dispatch work, maintenance downtime, and the opportunity cost of unavailable equipment.
- Handling and inventory: Capture cross-dock labor, touches, damage exposure, inventory ownership, and working capital.
- Service penalties: Include missed appointments, retailer deductions, customer credits, expedited recovery, and lost capacity from unstable schedules.
Use the model to compare direct, indirect, and hybrid options under normal and disrupted conditions. A distributor-heavy model may reduce direct delivery complexity but create visibility and replenishment challenges. A denser direct model may improve control while increasing route frequency and management overhead.
Define the scorecard before launch
A route should have measurable operating expectations before the first dispatch. Useful measures include on-time departure, on-time arrival, cost per delivery or shipment, order accuracy, dock dwell, damage, exception closure, and empty-mile exposure. Match each metric to an owner and a review cadence.
Your supply chain network design approach should also show how metrics trigger decisions. If dwell rises at one facility, examine appointment discipline, dock readiness, and paperwork before adding equipment. If order accuracy falls, review pick, sort, scan, and handoff controls rather than blaming the driver.
A KPI is useful only when someone knows what decision it should change.
Keep the scorecard small enough for daily execution and detailed enough for weekly diagnosis. The purpose isn't to collect every possible data point. It's to connect the numbers to route frequency, service level, partner selection, and replenishment rules.
Implementing and Optimizing Your Model
A route to market model fails when leaders treat launch as the finish line. The first operating design is a set of assumptions. Actual freight patterns, dock behavior, driver feedback, customer changes, and partner performance will test those assumptions immediately.
Implementation should begin with a controlled rollout. Assign one owner for the commercial design, one for transportation execution, and one for data integrity. Document the handoffs between warehouse, dispatch, carrier, distributor, and receiving facility. Every party should know the cutoff, tender process, loading standard, required documents, escalation path, and definition of a completed delivery.
Build execution discipline
Training needs to cover more than safe vehicle operation. Drivers and dock teams need consistent instructions for load checks, seals, scans, bills of lading, photos, exceptions, and facility-specific procedures. Dispatchers need a standard way to communicate delays instead of improvising a separate process for every customer.
Safety and compliance belong inside the RTM design. A low-cost lane that depends on rushed loading, unclear documentation, or unreliable staffing isn't an efficient lane. Professional W-2 drivers, maintained equipment, accurate records, and clear dispatch communication support repeatability because the company can manage expectations, training, and accountability through a defined operating structure.
Peak Transport can fit into this type of design as a Minnesota-based middle-mile operator running structured overnight box-truck routes between regional distribution facilities, hubs, and Amazon Relay nodes across the Twin Cities area. Its role is operational execution, with recurring lane structures, route planning, and W-2 drivers rather than a loose collection of last-minute capacity.
Use data to correct the design
Many companies lose visibility after freight leaves the warehouse. Secondary-sales data may be weak, distributor inventory may be slow-moving, and internal reports may not match outlet-level conditions. Recent RTM performance guidance identifies the limits of manual, intuition-based operations in a high-cost, competitive environment.
Review the model through a regular operating cycle:
- Observe: Capture dispatch, arrival, dwell, inventory, order, and exception data.
- Diagnose: Separate root causes from symptoms, such as late release versus late driving.
- Decide: Change frequency, cutoff, partner responsibility, consolidation rules, or service commitments.
- Test: Run the revised design under controlled conditions.
- Standardize: Update procedures, training, and scorecards once the change proves workable.
A route shouldn't be redesigned because of one isolated delay. A repeated pattern deserves action, especially when it affects margin, customer service, driver hours, or network capacity. The most resilient teams make optimization part of normal management rather than waiting for a crisis.
RTM Models in Action for Twin Cities Operations
Consider a national e-commerce brand using a hybrid route to market model. It sells directly through its digital storefront while also relying on marketplace and retail fulfillment channels. A regional fulfillment center near Minneapolis and St. Paul releases parcels, cartons, and replenishment freight toward Amazon Relay nodes and carrier hubs on overnight schedules.
The commercial design creates different physical requirements. Direct orders need dependable movement into fulfillment infrastructure that supports customer promises. Retail or marketplace replenishment may require consolidated transfers, stricter appointment coordination, and different documentation. A middle-mile operator must protect departure discipline because a missed overnight handoff can affect multiple downstream flows at once.
The brand shouldn't ask only whether a carrier can move the freight. It should ask whether the carrier can repeat the lane, communicate exceptions, maintain documentation, and operate safely when volume or weather disrupts the plan. Tools that improve driver communication, scanning, and dispatch visibility can help teams evaluate results with mobile apps for logistics without treating software as a substitute for sound lane design.
Now consider a large CPG company using an indirect model. It ships palletized products from a central distribution center into major retail distribution facilities serving the region. The manufacturer depends on scheduled linehaul, accurate appointments, clean pallet and document handling, and reliable receipt confirmation. The retailer or distributor owns much of the downstream relationship, but the manufacturer still carries the consequences of late or incomplete replenishment.
The two examples share a requirement, but not the same service logic. The e-commerce brand may need flexible node coordination and rapid exception communication. The CPG manufacturer may prioritize stable bulk movements and repeatable receiving performance. In both cases, the route to market model must be judged by cost-to-serve, working capital, and service penalties, not reach alone. Current RTM guidance on economics under volatility makes that trade-off central to resilient profitability.
Peak Transport provides structured overnight box-truck operations for distribution centers, regional hubs, and Amazon Relay nodes across the Twin Cities metro. If your RTM design needs dependable recurring lanes, safety-focused W-2 drivers, and data-informed route planning, visit Peak Transport to discuss a regional middle-mile operating plan.