Supply Chain Visibility Tools for Middle-Mile Success
Supply chain visibility tools explained for middle-mile operations. Compare core capabilities, evaluation criteria, KPIs, and a real overnight box-truck
October 10, 2026
At 2:00 a.m., a box truck is already behind schedule before anyone in dispatch knows there's a problem. The driver left a regional distribution center at midnight, but loading took longer than planned, traffic has slowed the route, and the appointment window at an Amazon Relay node is narrowing. The first warning may arrive through a customer call, not the transportation system.
That gap is where supply chain visibility tools earn their place. The useful question isn't whether a platform can place a truck on a map. It's whether the platform can detect a late departure, calculate the appointment risk, notify the right person, and trigger a documented dispatch action while there's still time to recover.
Why Visibility Decides Your Overnight Lanes
Overnight middle-mile work gives dispatch very little room for improvisation. A departure delay at a regional distribution center can become a missed relay appointment, a driver-hours problem, a failed handoff, or a disrupted sort sequence before the morning team arrives. A phone call after the appointment window has closed is information, but it isn't operational control.
The strongest visibility programs turn lane events into decisions. A geofence records when the truck arrives and leaves. The system compares the actual departure with the planned departure, recalculates the estimated time of arrival, and checks that estimate against the facility appointment. If the threshold is crossed, an assigned dispatcher contacts the facility, re-sequences a pickup, or protects the driver's remaining hours.
Operational rule: An alert has value only when someone owns the next action.
This article focuses on that distinction. It explains what supply chain visibility tools actually capture, which capabilities matter on DC-to-relay box-truck lanes, and how to evaluate vendors without being distracted by a crowded dashboard. It also covers the KPIs that establish whether a tool is working, the data model needed to make those KPIs trustworthy, and a practical implementation approach for overnight operations.
The shift is straightforward, but it requires discipline. Dispatch teams need to move from manual check calls and scattered updates toward a shared stream of time-stamped events, clear escalation rules, and corrective actions that can be reviewed after the trip. For a deeper look at the role of live shipment status in transportation operations, see this guide to real-time shipment tracking.
What Supply Chain Visibility Tools Actually Do
A visibility platform is best understood as a shared flight-status board for freight. It collects events from trucks, drivers, facilities, carriers, warehouse systems, and customer platforms, then presents a common operational record. The important events include departure, arrival, dwell, appointment status, route milestones, scans, proof of delivery, and exceptions.
A map with moving dots is only one display layer. A useful system answers four connected questions:
- What was supposed to happen? The load had a planned departure, route, facility, and appointment window.
- What has happened? The truck departed, reached a geofence, paused, or missed a scan.
- What is likely to happen next? The current ETA may threaten the appointment or downstream capacity.
- Who must respond? Dispatch, the facility, the carrier, or the customer has an assigned intervention.
The category expanded after the disruption-heavy period beginning in 2020. Companies moved from checking shipments after a problem occurred toward continuous monitoring, shared data, analytics, and earlier intervention. A 2024 supply chain visibility trend analysis from Maersk reported that 77% of companies prioritized visibility investments in 2022, identified more than 20 visibility startups entering the field since 2015, and counted more than 5,500 related patents filed globally between 2019 and 2023.
The event model matters more than the dashboard
For an overnight box-truck lane, the event model might begin with a load ID and planned departure timestamp. The truck's telematics system contributes location and route data. A driver or warehouse scan confirms loading. A facility geofence records arrival and departure. The appointment system supplies the planned window. The visibility tool reconciles those signals and decides whether the lane is proceeding normally.
Seeing data tells you where the freight is. Actionable visibility tells you what the team must do next.
That distinction separates useful supply chain visibility tools from passive tracking screens. If a platform generates an alert without an owner, threshold, or response record, it has increased notification volume rather than operational control.
Core Capabilities That Matter for Middle-Mile Operations
Middle-mile buyers should evaluate capabilities by the question each one answers during a live overnight move. Real-time tracking answers, “Where is the vehicle now?” ETA calculation answers, “When should it reach the next facility?” Exception management answers, “Who needs to act before the appointment is lost?”
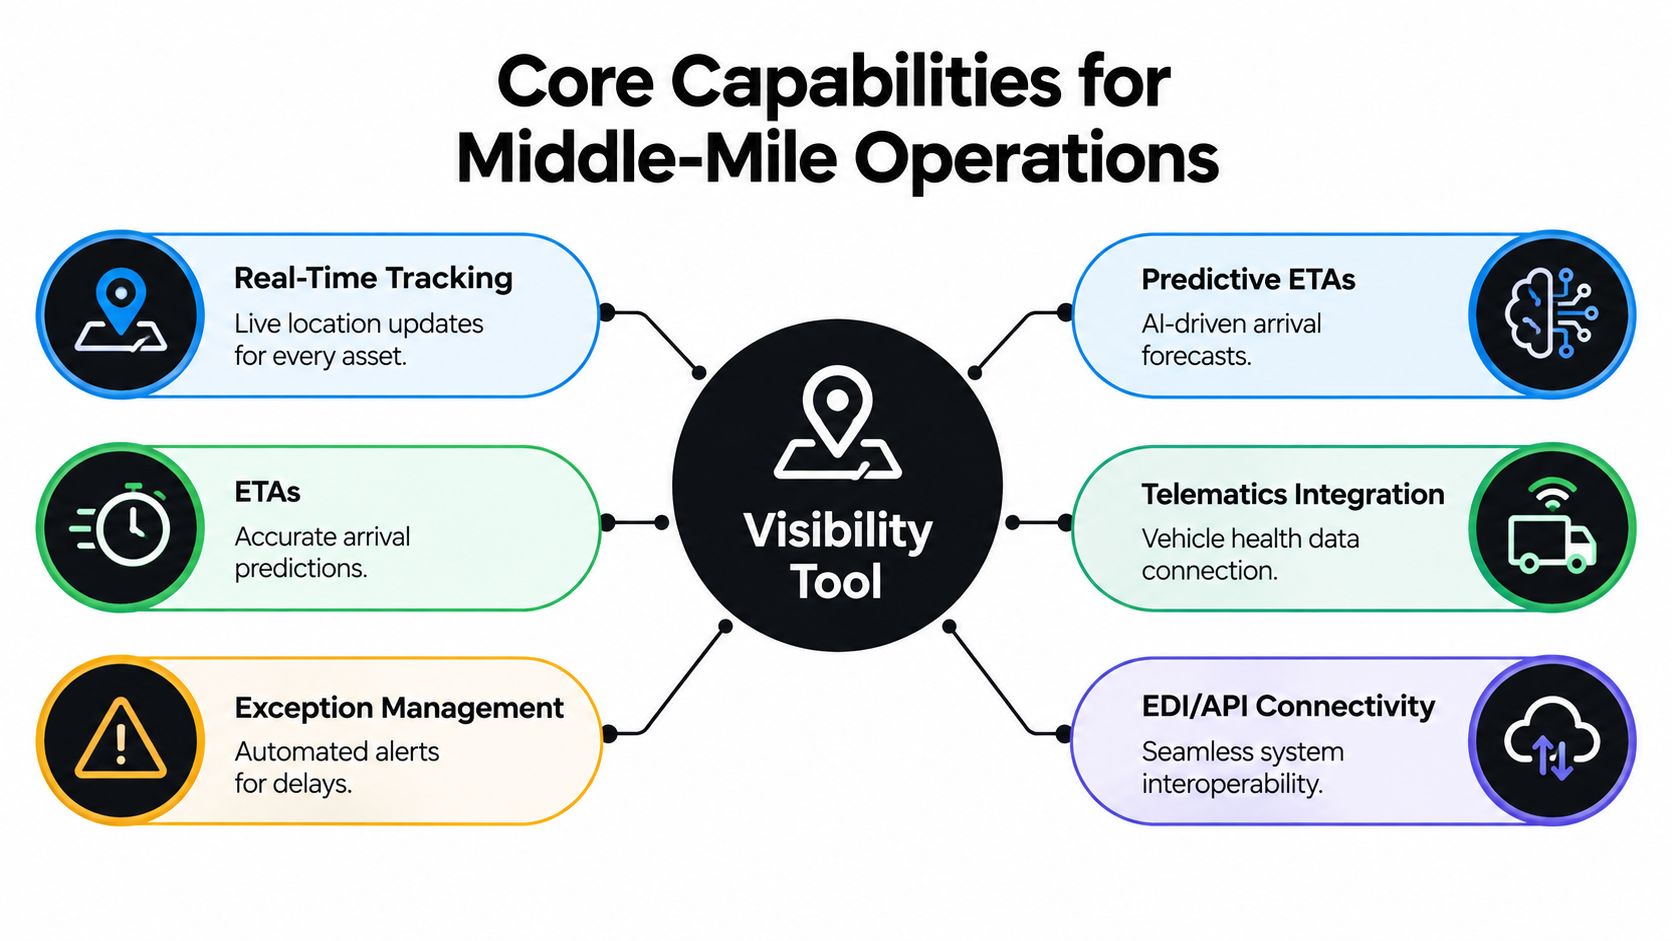
Six capabilities with a dispatch purpose
- Real-time tracking: Live vehicle location helps dispatch verify whether a truck has left the origin, remains at a facility, or has deviated from the planned route.
- ETA calculation: The system compares current movement with the appointment window, giving dispatch time to contact the receiving facility when arrival risk develops.
- Exception management: Alerts should classify events such as late departure, excessive dwell, route deviation, missing scan, or appointment threat. Each category needs a named response.
- Predictive ETAs: A predictive estimate can combine current location, route progress, facility events, and historical operating conditions. Its value depends on confidence and the action tied to the forecast.
- Telematics integration: GPS, vehicle status, and related telematics data become useful when they connect to load, driver, facility, and appointment records.
- EDI and API connectivity: System interoperability lets dispatch, route planning, warehouse appointments, and customer platforms work from shared identifiers instead of separate records.
A 2026 mixed-methods study of 214 supply-chain professionals found the strongest measured IoT effects were on information timeliness, with β = 0.61, and information accuracy, with β = 0.57. The same study reported that organizations with mature ERP and IoT integration achieved transparency gains approximately 2.3 times greater than organizations using isolated deployments. These findings are reported in the study record and paper.
The practical lesson is clear. Adding another sensor won't solve a broken event model. A truck's location must reconcile with the load ID, vehicle ID, facility code, planned appointment, and actual timestamps. If the departure scan lives in one system and the appointment lives in another, the dispatcher still has to assemble the situation manually.
A typical middle-mile configuration should monitor geofenced arrival and departure, dwell time, ETA against the appointment, route adherence, and scan completeness. The platform should also distinguish a routine late update from a delay that threatens a handoff or driver-hours limit.
This video offers additional context on the role of visibility in connected logistics operations.
How Visibility Supports Overnight Box-Truck and DC-to-Relay Lanes
An overnight box-truck network has a narrow operating rhythm. A vehicle leaves a distribution center, travels to a relay or hub, completes a handoff, and may continue into another scheduled move. The system needs to protect more than shipment location. It must protect the appointment window, driver hours, facility capacity, and the next planned movement.
Facility-level visibility can look strong while broader risk remains hidden. McKinsey's 2024 Global Supply Chain Leader Survey found that 60% of respondents reported full visibility into tier-one suppliers, a 10-percentage-point increase for the second consecutive year, while visibility into deeper supply-chain levels declined by 7 percentage points. The McKinsey supply chain risk survey illustrates why a shipment scan shouldn't be treated as complete supply-chain transparency.
Consider a DC-to-relay lane. The truck's departure event may be visible, but an upstream supplier delay can reduce inventory available for the next load. A receiving facility may have limited sort capacity. A missed handoff can create a downstream bottleneck even when the original truck remains easy to locate.
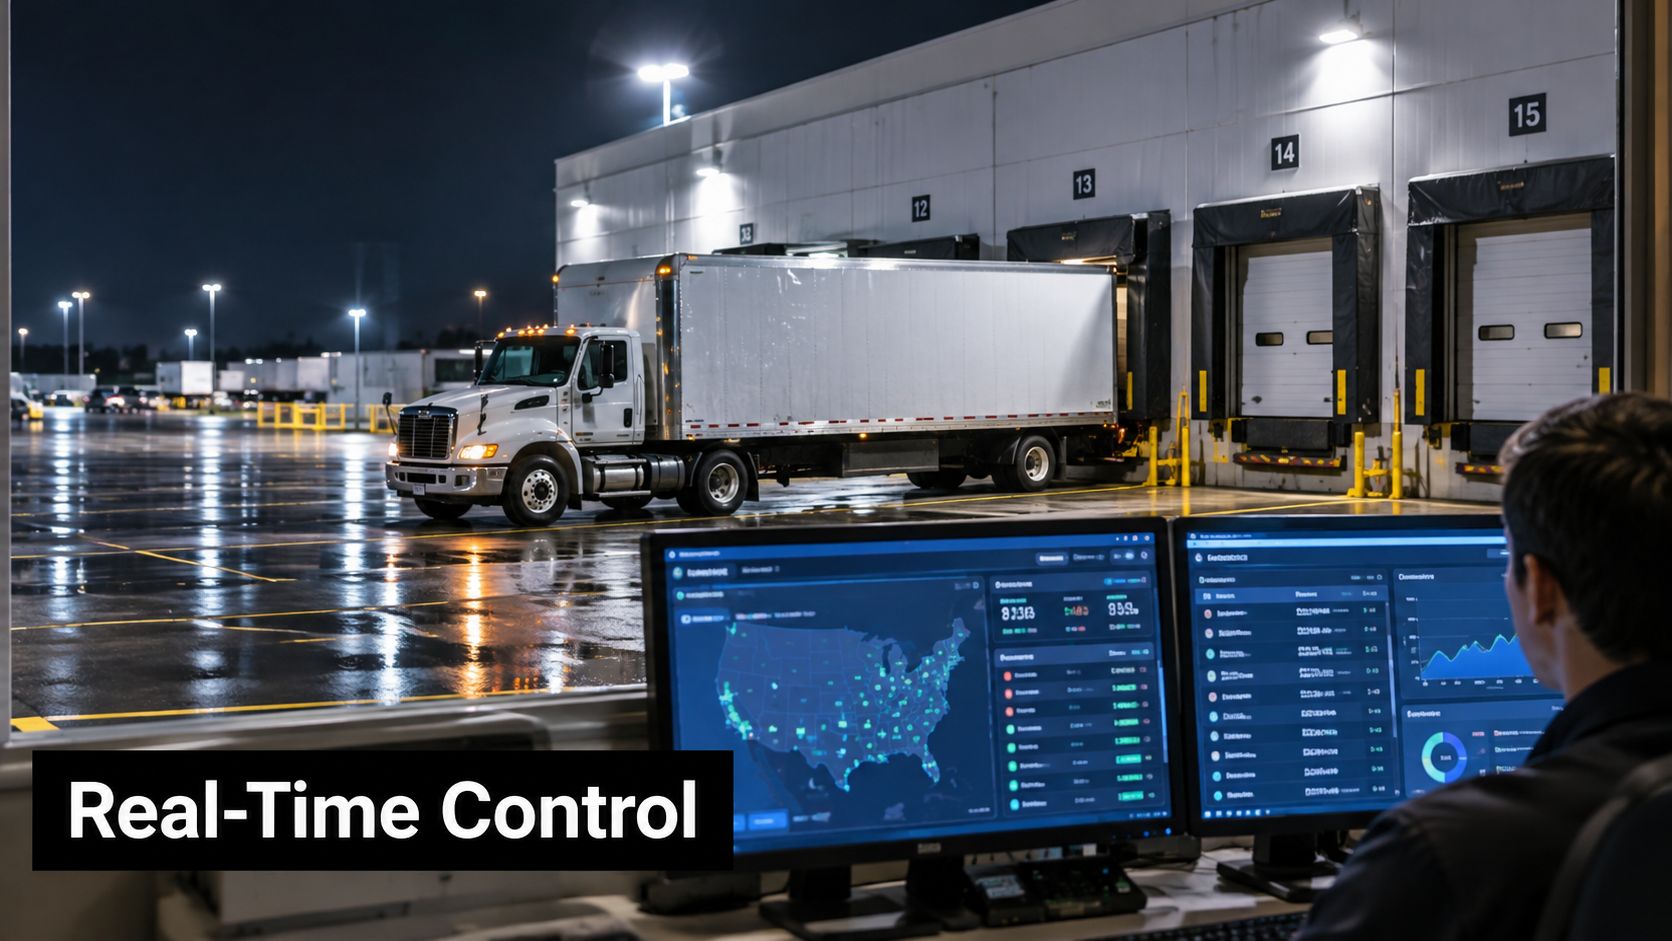
Turning events into lane protection
A late departure should trigger an ETA recalculation. If the revised ETA threatens the receiving window, the system should route the exception to the dispatcher responsible for that lane. The dispatcher may call the facility, adjust the next pickup, assign a recovery move, or preserve the driver's hours rather than forcing an unsafe scramble.
Excessive dwell deserves the same treatment. A geofence can show that the truck reached the origin, while a dwell threshold reveals that loading has not progressed. That distinction lets dispatch intervene before the delay becomes a missed relay appointment.
For operations that span different sites and partners, external risk resources can also help teams think beyond vehicle location. A practical reference on San Diego logistics risk mitigation is useful when reviewing facility, security, and continuity risks that may sit outside the transportation screen.
The best design combines carrier status, appointment data, route milestones, facility events, and upstream signals. It doesn't promise that every risk will be visible. It creates enough reliable context for dispatch to recognize which event threatens the next operational commitment and respond before the disruption propagates.
How to Evaluate and Implement the Right Visibility Tool
A vendor demonstration can make almost any platform look capable. The test that matters is whether the system supports a specific action at an inconvenient hour, with incomplete data, conflicting updates, and a customer waiting for an answer.
PwC's 2025 supply-chain study found that 82% of leaders believe real-time data is ineffective without actionable insights, while 76% lack a predictive view of supply and demand. A separate 2025 survey of supply-chain technology leaders reported that 60% identified poor integration between tools as their primary pain point. The findings are summarized in the PwC supply-chain report.
Score the response, not the screen
Ask vendors to demonstrate a late departure from a real overnight lane. Require the platform to show the event, recalculate the ETA, apply the escalation rule, identify the owner, record the action, and close the exception. If the demonstration stops at a red icon on a map, the tool hasn't proven operational value.
Evaluate these areas:
- Exception ownership: Can each alert route to a named role, shift, or dispatch queue?
- Escalation rules: Can the operation set thresholds for dwell, route deviation, ETA risk, missing scans, and appointment exposure?
- Data quality: Can the platform show event completeness, latency, source, and confidence?
- Integration effort: Does it support API and EDI connections, shared master data, duplicate-event handling, and conflicting updates?
- Security and governance: Are role-based access, retention, audit trails, and partner permissions clear?
- Offline resilience: What happens when a driver or facility submits a delayed update rather than a live event?
The cloud-based TMS software guide provides useful context for thinking about transportation systems as connected operational tools rather than isolated databases.
Run a controlled pilot
Start with real overnight lanes, not synthetic test data. Establish a baseline for on-time arrival, dwell, empty miles, exception response time, documentation completeness, and schedule adherence before enabling new alerts.
Then define the pilot's operating rules:
- Assign an owner to every alert category.
- Set the response threshold and expected action.
- Reconcile load, vehicle, facility, and appointment identifiers.
- Test missing, delayed, and duplicate events.
- Review every alert that reached dispatch, including false positives.
- Compare the resulting records with customer and facility documentation.
Security shouldn't be treated as an implementation footnote. Visibility expands operational awareness, but it also expands the amount of partner and transportation data that systems must protect. A tool that produces nominally real-time information but cannot explain its source, access controls, or audit history may create a new control problem.
KPIs and Data Models That Prove the Tools Work
A visibility tool doesn't prove its value by showing more events. It proves value when reliable events change operating outcomes. For middle-mile execution, the core measures are on-time arrival, dwell minutes, empty miles, exception response time, documentation completeness, and schedule adherence.
Continuous event capture shortens the delay between a route deviation, missed facility handoff, or late arrival and the manager's ability to intervene. Research on large-enterprise visibility systems connects that shorter response gap with actions such as reassignment, customer notification, appointment recovery, and driver-hours protection, as described in this research on enterprise visibility systems.
Build one shared record
Dispatch, route planning, warehouse appointments, and customer systems need common identifiers. A practical model uses load ID, vehicle or trailer ID, facility code, driver assignment, event type, event source, planned timestamp, actual timestamp, and status history.
Without those fields, a late departure may be recorded against one load number, while the facility appointment uses another reference. The dashboard can still look active, but the KPI calculation won't be trustworthy.
| KPI | Event Data Required | Decision It Drives |
|---|---|---|
| On-time arrival | Facility arrival, planned appointment, actual arrival | Contact the facility, recover the appointment, or review lane planning |
| Dwell minutes | Geofenced arrival and departure, loading status | Escalate slow handling or re-sequence the next movement |
| Empty miles | Planned route, actual route, load status, vehicle location | Adjust dispatch planning and reduce unnecessary movement |
| Exception response time | Alert creation, assignment, acknowledgement, action, closure | Review dispatch responsiveness and escalation discipline |
| Documentation completeness | Pickup, delivery, scan, signature, and proof-of-delivery events | Correct missing records before billing or compliance review |
| Schedule adherence | Planned departure and arrival against actual timestamps | Rework lane timing, staffing, or facility coordination |
Data governance determines whether these measures can survive an audit. Teams should know which system owns each field, how duplicate events are resolved, and how delayed updates are labeled. For organizations building operational reporting, this resource on security and KPI dashboard implementation offers useful context on connecting performance measurement with controlled access and reporting design.
A KPI dashboard should expose the underlying event trail, not only the final percentage or status color. If a manager can't trace an on-time arrival to the relevant facility, appointment, and timestamp, the metric may be visually polished but operationally weak. Teams looking to formalize their measurement system can also review these key performance indicators.
A Middle-Mile Scenario in Practice
Consider a Minnesota-based box-truck operator running an overnight lane between an MSP-area distribution center and an Amazon Relay node. The plan calls for the truck to leave shortly after midnight and reach the receiving facility within its scheduled appointment window. Dispatch has already linked the load ID, vehicle, origin, destination, and appointment to the movement.
The first event is routine. The truck enters the origin geofence, the driver completes the required check-in, and the loading record begins. The departure event arrives later than planned. Instead of waiting for a manual check call, the visibility system recalculates the ETA and compares it with the receiving window.
The revised ETA crosses the lane's escalation threshold. That alert goes to the overnight dispatcher, who owns the response. The dispatcher contacts the origin to confirm whether the load is still being completed, notifies the receiving facility that the appointment is at risk, and checks whether the next planned pickup can be re-sequenced without creating a driver-hours problem.
The alert has a job
The truck then leaves the origin and reaches a short traffic slowdown. The route remains within tolerance, so no escalation is needed. Later, the vehicle enters the receiving geofence but remains stationary beyond the expected dwell period. The system creates a dwell exception, and dispatch checks whether the facility has accepted the load or whether the driver is waiting for a handoff.
That sequence is different from a passive dashboard. The tool doesn't replace the dispatcher. It gives the dispatcher a timely event, a defined threshold, and a record of the corrective action. If the facility changes the appointment, that change becomes part of the shipment history rather than remaining in an informal text message.
The same data supports post-trip review. Operations can compare planned and actual timestamps, verify documentation completeness, review the exception response, and examine whether the route created unnecessary mileage. Structured records also help managers check safety compliance and protect driver hours when recovery decisions are made under pressure.
Peak Transport's model fits this type of operating environment. Peak Connect Track provides shipment tracking across the shipment life cycle, updates shipment information as carrier updates are received, and can return status history for submitted pickup requests. In practice, the value of such a system depends on how those events connect to dispatch ownership and lane decisions.
Visibility Buys Detection, Discipline Buys Performance
Supply chain visibility tools create the opportunity to intervene earlier, but they don't operate the lane by themselves. The tool detects the late departure, missing scan, excessive dwell, or appointment threat. Dispatch discipline turns that detection into performance through ownership, escalation rules, communication, and documented corrective action.
The decision path is practical. Define the event model first. Score vendors on exception workflows, ETA confidence, data completeness, integration, security, and auditability rather than dashboard volume. Baseline the KPIs before a pilot, then test the system on real overnight lanes with real facility and partner conditions.
Middle-mile logistics works better when teams engineer the operating rhythm instead of improvising after the customer calls. Reliable execution comes from accurate timestamps, clear dispatch records, protected driver hours, and a shared understanding of what happens next.
Peak Transport provides structured overnight box-truck operations across the Twin Cities metro and surrounding areas, connecting distribution centers and relay nodes with data-informed planning, clear dispatch communication, and safety-focused execution. Visit Peak Transport to discuss dependable middle-mile coverage for your freight or explore W-2 overnight driving opportunities in Minnesota.