Less Than Truckload Shipments: How LTL Pricing Works
Less than truckload shipments explained: how LTL works, how class and density set rates, hidden accessorial charges, and how to pack and track them.
November 17, 2026
A less than truckload shipment shares a trailer with freight from other shippers and is billed on weight, freight class and distance rather than on the whole truck. That class comes from the National Motor Freight Classification scale, which runs from 50 to 500 and is set mainly by density, handling, stowability and liability.
Six pallets are staged on your dock at 4:40 on a Thursday, the order has to land in another state by Monday, and the quote you pulled this morning shows one number while the invoice arriving three weeks from now may show another. That gap between the quoted rate and the final delivered cost is where most first-time less than truckload shipments surprise the people who booked them.
The rate on the quote is only one input. Density, freight class, accessorials, terminal touches, claim exposure and lane volume all move the final figure, and they don't move it in the same direction. Learn the mechanics in order and the surprises stop being surprises.
What Less Than Truckload Shipping Means
The practical boundary is weight and pallet count. LTL suits freight in the lighter range, usually a few pallets, and carriers price it as part of a shared trailer. Past that range the math tends to flip toward full truckload, because a dedicated trailer stops costing much more than the space you would reserve inside someone else's.
A bus-and-taxi split makes the mechanics concrete. LTL works like a seat on a shared bus: you buy the space your freight occupies, the bus stops at terminals along the way, and other shippers' freight rides with yours. Full truckload works like a taxi hired for the whole trip. It leaves when you say and goes where you say. You pay for the empty seats regardless.
LTL is a large slice of trucking, not a side service. U.S. Bureau of Transportation Statistics data show LTL firms generated $41.740 billion in shipment revenue in 1989, about 39% of the combined truckload and LTL total of $107.645 billion reported that year, rising to $51.604 billion by 1993 (BTS).
The table below is the reference point for everything that follows. When a later decision feels ambiguous, come back to it.
LTL versus full truckload at a glance
| Factor | Less than truckload (LTL) | Full truckload (FTL) |
|---|---|---|
| Typical shipment size | Under about 15,000 lb, part of a trailer | Usually a full trailer, often above 15,000 lb |
| Trailer use | Shared with other shippers' freight | Dedicated to one shipper |
| Pricing basis | Weight, freight class, distance and accessorials | Usually a rate for the whole truck, often per mile |
| Transit pattern | Scheduled terminal stops, often multi-day on longer lanes | Direct movement, usually faster and more predictable |
| Handling touches | Multiple terminal sorts and transfers | Usually origin and destination only |
| Best fit | Smaller, flexible or multi-stop shipments | Heavy loads, time-sensitive or dedicated moves |
You pay for a share of the trailer, not a promise that the share will be the lowest bill. The quote prices the space. Delivered cost is what remains after the freight has been handled, transferred and signed for. A few pallets on a flexible lane usually belong on the shared bus. A heavy load that needs a direct, predictable move usually belongs in the taxi, or on a route scheduled between facilities in advance.
How an LTL Shipment Moves Through the Network
A pallet leaves your dock on a Tuesday afternoon. Before a consignee signs for it, five sets of hands have already moved it. LTL works like a package moving through hub terminals: each stop exists to combine freight heading the same direction, not to run your freight straight to the door.
The infographic below shows the five stages in sequence.
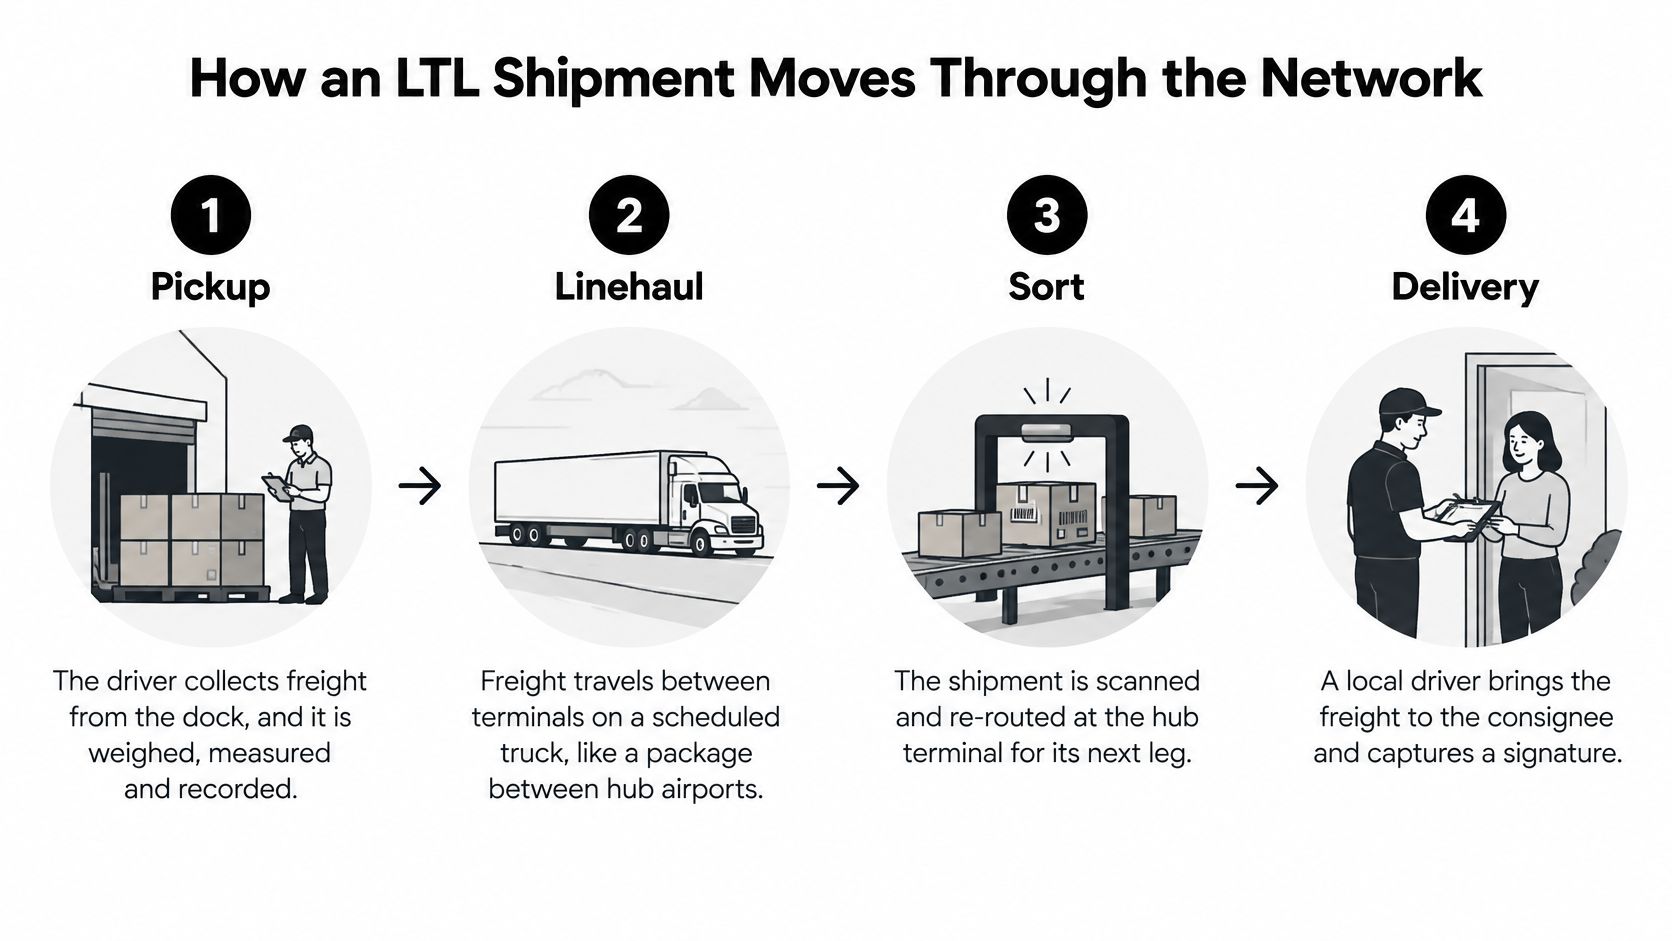
- Pickup. A local driver collects the freight from your dock. The shipment is weighed and measured, and the freight class on the paperwork is confirmed or corrected. A wrong dimension here becomes a reclassification, and that correction shows up on the bill, not on the original quote.
- Origin terminal. Freight is sorted by destination and loaded onto a trailer alongside other shippers' cargo. This is the first consolidation point. Miss the cutoff and the pallet waits for the next scheduled departure, which adds a day you still pay for in time.
- Linehaul. The trailer runs between terminals on a scheduled lane, often overnight. It leaves on a timetable even when the trailer still has open floor space, which is why the cutoff matters more than whether a truck happens to be available.
- Destination terminal. Your freight is unloaded, cross-docked and sorted onto a local delivery route. Every scan here should update the tracking record. A missed scan is how a pallet looks lost while it is only sitting on the wrong trailer.
- Final delivery. A local driver makes the drop, often by appointment, captures a signature and returns proof of delivery.
Two documents travel with the load. The bill of lading is both the receipt and the contract of carriage, and it carries the commodity description and class that pricing depends on. The PRO number is the carrier's shipment identifier. That number is what you use to trace a load from terminal to terminal.
The network took this shape because carriers had to fill trailers to survive. A Federal Trade Commission review reports that average LTL rates fell by about 12% after deregulation while Class I LTL carriers, those above $10 million in revenue, dropped from more than 600 in 1976 to approximately 50 in 1995 (FTC). The carriers that remained compete on density and terminal discipline. That is the system your pallet enters.
Count the touches on each of your lanes. Each one adds dwell time and another chance for damage or a paperwork mismatch, and either one pushes the delivered cost above the quoted rate. When freight has to cross a border or catch a deadline LTL cannot serve, teams switch modes, and customs clearance for urgent shipments becomes the gating step rather than the truck schedule.
Here's the short video walkthrough of the same flow.
Delays most often begin in three places: the pickup cutoff, the terminal sort, and the delivery appointment. Watch those three before you treat the linehaul miles as the problem.
How Freight Class and Density Set Your Rate
A 48 by 40 by 48 inch pallet looks the same on the dock whether it holds light cartons or dense product. Carriers price those two loads differently. The National Motor Freight Classification assigns classes from 50 to 500 using four transportability attributes: density, handling, stowability and liability. A trailer works like floor space rented by the room a pound takes, not by the pound itself. Lower-density freight occupies more trailer and terminal space per pound, so the class, and the rate, go up.
That pallet holds about 53.3 cubic feet. Load it to 500 pounds and density is roughly 9.4 pounds per cubic foot, which lands in Class 100. Stack the same footprint to 1,500 pounds and density triples. The class drops, and the rate per pound drops with it. The number on the quote is the price for the class you declared. If the terminal later measures a lighter cube, the class rises and the delivered cost rises with it, even when no extra service was ordered.
NMFC density bands and freight classes
| NMFC class | Density (lb per cubic foot) |
|---|---|
| Class 50 | 50 and above |
| Class 55 | 35 to 50 |
| Class 60 | 30 to 35 |
| Class 65 | 22.5 to 30 |
| Class 70 | 15 to 22.5 |
| Class 85 | 12 to 15 |
| Class 92.5 | 10.5 to 12 |
| Class 100 | 9 to 10.5 |
| Class 110 | 8 to 9 |
| Class 125 | 7 to 8 |
| Class 150 | 6 to 7 |
| Class 175 | 5 to 6 |
| Class 200 | 4 to 5 |
| Class 250 | 3 to 4 |
| Class 300 | 2 to 3 |
| Class 400 | 1 to 2 |
| Class 500 | Under 1 |
When density isn't the whole story
Handling can override a good density number. Freight that needs special equipment, comes in nonstandard dimensions, or takes extra loading precautions moves up the scale even when it cubes tightly. Stowability works the same way. A shipment that cannot sit efficiently beside other freight still consumes space when it is heavy. Liability is the last layer, covering exposure to damage, theft or regulatory risk. Any of those three can put a higher class on the invoice than the density band alone would suggest, which is why the paperwork has to describe the freight the terminal will handle.
Practical rule: improve density through better palletization, not through heavier boxes. Standard pallets, corner protection, stretch wrap and clear handling labels raise trailer utilization without adding gross vehicle weight.
Check your class against your last invoice
Take the pallet you ship most often. Measure it with a tape rather than from memory. Divide weight by cubic feet, then look up the band. Compare that class to the one printed on your last quote.
If the commodity description on your paperwork is vague, the class becomes a judgment call at the terminal. Use an NMFC code lookup to confirm the item number before dispatch rather than after the invoice arrives.
Accessorial Charges That Change the Delivered Cost
The quote that looks 10 percent cheaper is not always the cheaper shipment. A base rate plus fuel surcharge covers the linehaul and almost nothing else, while reclassification, residential fees, a liftgate, detention and a redelivery can all appear on the invoice after the freight has moved.
The honest comparison is delivered cost, and it has six parts.
Delivered cost = linehaul + fuel + accessorials + expected reweigh or reclassification adjustments + claims exposure + your internal cost of managing exceptions.
That last term is the one shippers forget. Every reweigh dispute, redelivery call and invoice correction consumes somebody's afternoon. It doesn't show up on a carrier statement, but it shows up in your labor cost and your credibility with the customer waiting on the load.
Shippers in recent LTL research continue to rank billing accuracy and accessorial pricing alongside pickup reliability and damage prevention, which puts invoice predictability squarely in procurement rather than accounts payable (FreightWaves).
Common accessorial charges and how to avoid them
| Charge | Triggered when | How to prevent it |
|---|---|---|
| Liftgate service | Delivery site has no dock and no forklift | Confirm dock or forklift at booking |
| Residential delivery | Delivery goes to a home or non-commercial address | Give the business address or schedule an appointment |
| Limited-access delivery | Site is gated, rural or restricted | Disclose access conditions at quote stage |
| Inside delivery | Freight must be carried past the dock | Specify inside delivery at booking |
| Detention | Driver waits beyond free time | Ready the dock and keep appointment buffers |
| Redelivery | Consignee is unavailable or refuses freight | Confirm appointment and a contact name in advance |
| Reclassification or reweigh | Measured dimensions, weight or class differ from the quote | Measure accurately and verify density data before dispatch |
Most of these charges are preventable with information you already have. The failure is rarely the carrier's pricing. It's a residential address typed as commercial, a pallet measured by eye, or a receiver who didn't know freight was coming.
Three requests before you book
Ask for the carrier's full accessorial schedule in writing, not a summary of the common ones. Ask for a redacted sample invoice from a comparable shipment so you can see how fuel, accessorials and adjustments are presented. Then ask for written rules on how reweighs and reclassifications are billed, including the window in which you can dispute one.
Invoices that match quotes are a design outcome, not luck. Build the shipment data checklist before dispatch: actual pallet dimensions, scale weight, density or class, stackability, dock conditions, appointment requirements and delivery type. Each item on that list maps to a charge on the table above.
Reliability Risks by Shipment Weight and Lane
On-time performance tracks the freight profile as much as the transit plan. An industry analysis reported that shipments around 1,000 pounds showed the strongest on-time pickup and delivery performance, while shipments above 5,000 pounds showed greater variance (C.H. Robinson).
The mechanism is consolidation. LTL freight gets sorted, cross-docked and assigned to scheduled linehaul movements, so a heavy or irregularly shaped shipment has fewer compatible partners to travel with. It also depends more heavily on one specific dock door, trailer or cutoff window. A light pallet slots into almost any trailer. A 6,000-pound awkward one waits for the right one.
Lane volume matters for a similar reason. High-volume lanes perform better because demand and operating patterns are predictable, and predictability is what a scheduled network runs on.
Terminal geography adds a wrinkle. Origins closer to terminals tended to achieve better on-time delivery, while more distant origins could show stronger pickup performance under certain network conditions. If your facility sits two hours from the serving terminal, your pickup experience and your delivery experience may not match, and that's a network effect rather than a carrier failing.
Practical rule: a 6,000-pound pallet that misses a terminal cutoff by an hour doesn't catch the next available truck. It waits for the next scheduled linehaul, and the delay is a day, not an hour.
Four responses that actually move the number
- Segment by weight and cube. Treat your under-1,000-pound freight and your over-5,000-pound freight as separate problems, because the network treats them that way.
- Publish dock-ready times you can hit. A freight-ready time that assumes a two-hour wrap is worse than a later one you never miss.
- Protect cutoff buffers. Build the margin before the terminal cutoff rather than into the customer promise.
- Favor repeatable regional lanes. Stable volume on a fixed lane beats a cheaper one-off movement that has no operating history.
Document every exception the same day it happens. A missed sort that's written down and escalated becomes a recovered delivery. An unrecorded one becomes a customer complaint with no explanation attached.
How to Pack, Document and Claim an LTL Shipment
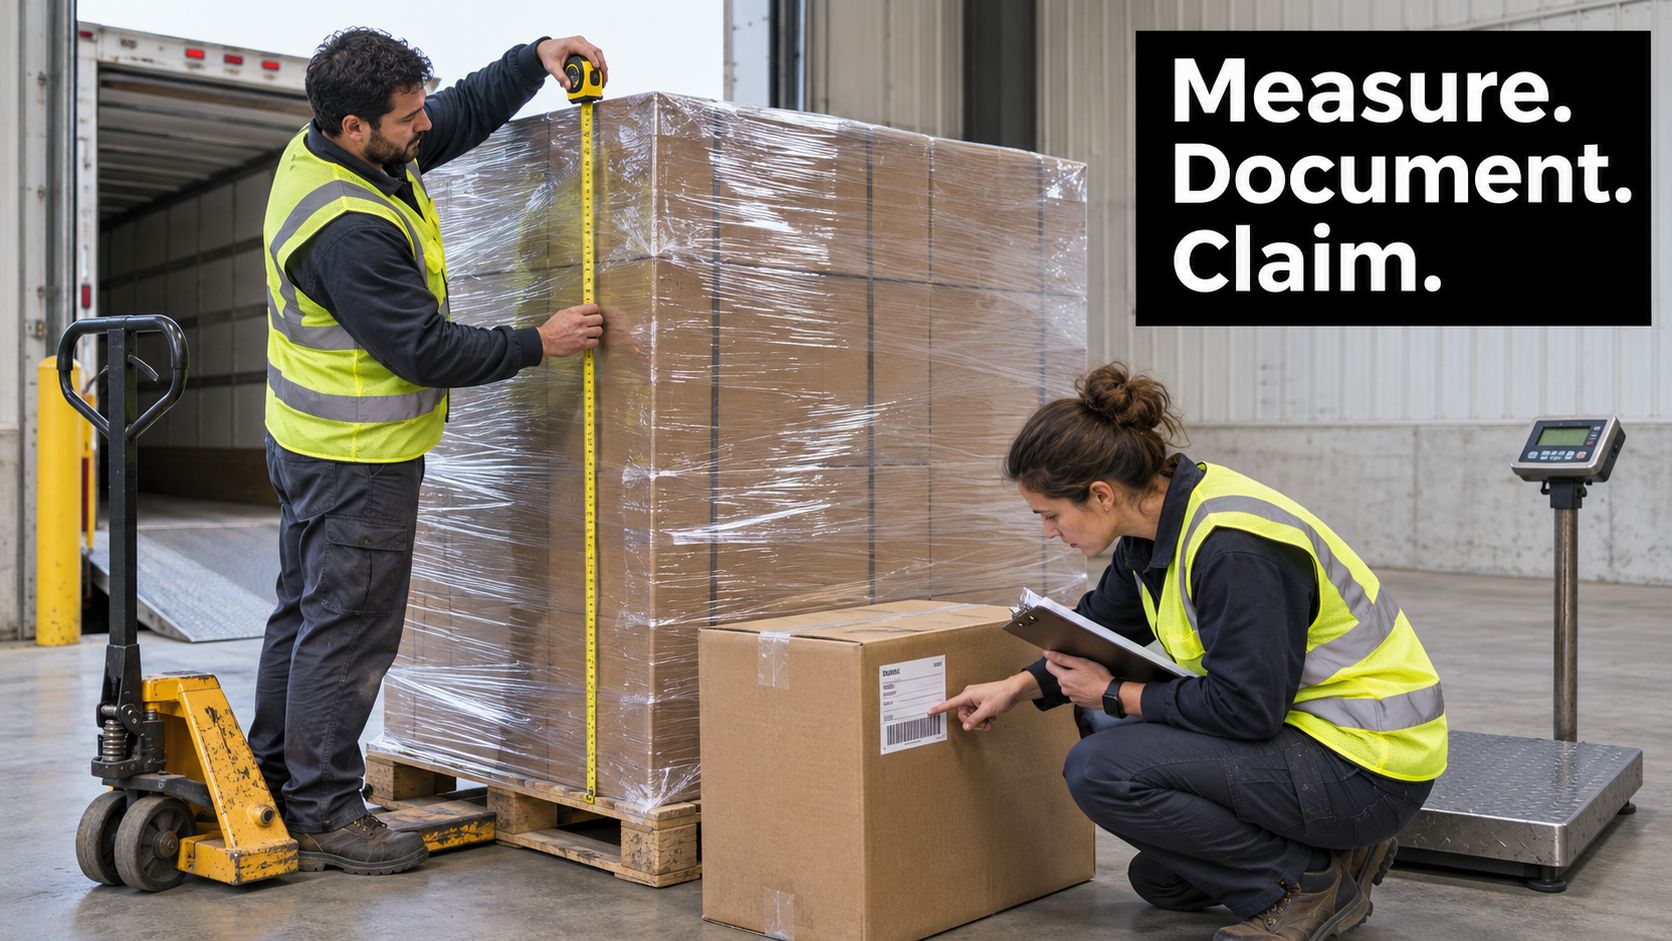
Dock discipline is the cheapest insurance in freight. Run this procedure on every outbound load and most reclassification and damage disputes disappear before they start.
- Measure each handling unit for length, width, height and weight on the same scale the carrier will use for billing. Mismatched data is the single most common trigger for reclassification.
- Build standard pallets within the carrier's size limits and keep the load inside the pallet footprint. Overhang creates stowability problems and puts the freight at risk from the next pallet set against it.
- Stretch-wrap the load and add corner boards on the vertical edges. The wrap holds the cube together and the boards take the abrasion when freight shifts in transit.
- Label every unit with pallet count, weight, freight class and handling notes such as fragile or do not stack. A driver sorting twenty stops reads labels, not paperwork.
- Match the bill of lading to what's on the pallet. A commodity description that drifted from the actual contents is a reclassification waiting to happen.
- Photograph the freight at pickup, count the units, and note any visible damage on the bill of lading before the driver leaves the dock. A signature without a damage note is very hard to unwind.
- File any claim inside the carrier's window with photos, the bill of lading, the packing list, the invoice value and a repair estimate. Missing documentation, not missing damage, is why most claims stall.
The compliance layer most shippers skip
The bill of lading is the contract of carriage, so the declared value and liability option need to be stated at booking, not negotiated after a loss. Confirm the carrier's claim-filing deadline in writing before your first shipment, because it's shorter than many expect and it starts from delivery, not from discovery.
Understanding which fields carry legal weight is worth an hour of your time. This guide to how to read a bill of lading walks the sections that matter when a claim or a reweigh is disputed.
Packaging errors also compound downstream. If your fulfillment team is building cartons that collapse under stacking, the pallet fails before the carrier touches it, and the fixes for common pick and pack errors apply directly to freight prep.
The test is simple. Freight should arrive in the condition it left in, and the invoice should match the quote. If either one misses, the dock procedure has a specific step to tighten.
KPIs to Track on Every LTL Lane
You can't compare carriers or lanes on rate alone. Track the same measures on every lane, from pickup to invoice, and the differences stop being opinions.
LTL lane KPIs and how to calculate them
| KPI | How to calculate | What it reveals |
|---|---|---|
| On-time pickup rate | Pickups made on time divided by total pickups | Dock-ready discipline and cutoff planning |
| On-time delivery rate | Deliveries made on time divided by total deliveries | Network reliability across sorts and connections |
| Damage rate | Shipments with damage divided by total shipments | Packaging and handling quality |
| Claims ratio | Claims paid divided by freight spend | Financial exposure from damage and loss |
| Cost per delivered unit | Total delivered cost divided by units delivered | True cost including accessorials and rework |
| Invoice accuracy | Invoices matching quoted terms divided by total invoices | Billing drift and accessorial surprises |
| Dwell time | Hours freight waits at a terminal between touches | Likelihood of delay and damage |
Different denominators tell different stories, and most scorecards mislead on this point. A lane can show low damage frequency and still carry high claim cost, because one heavy claim dominates the year. Track shipment-level damage frequency and claims as a share of freight spend as two separate numbers, and neither one can hide behind the other.
Set a baseline before you compare anything
Run the measures for 30 days before you judge a carrier, switch a lane or renegotiate. A single bad week is weather, a single good month is a light quarter. Once you have a baseline, record touch count and dwell time next to the rates, because they explain why a metric moved when the rate didn't.
Reading two metrics together takes skill. Say on-time pickup falls while on-time delivery holds steady. The linehaul is fine, and the problem sits on your dock: freight isn't ready when the driver arrives, so pickups get rescheduled but recovery downstream absorbs the difference. Reverse the pattern, delivery slipping while pickup holds, and the issue is in the network rather than in your warehouse.
Assign one owner to each KPI and one review meeting where the numbers get read out loud. Data that lives in a monthly report nobody opens changes nothing. Data with a name attached to it gets fixed. Where your transportation and warehouse systems already talk to each other, the numbers arrive without anyone rebuilding a spreadsheet, and Wistec's guide to ERP logistics integration shows what that connection looks like in practice.
Choose Consolidated LTL or a Scheduled Middle-Mile Route
A shipper has 18 pallets leaving the same dock five nights a week, and none of them fill a trailer. The LTL quote looks cheaper on the rate sheet. After a reweigh, a liftgate, two missed appointments and one damage claim, the invoice no longer matches that quote. Delivered cost, not the number on the quote, decides whether those pallets should share a trailer or ride a scheduled middle-mile route.
Consolidate when the freight is not time-critical, packed for extra handling, compatible with whatever else is on the trailer, and moving on a lane that already has enough volume to fill space. Choose a scheduled move when the goods are damage-sensitive, the receiver needs a tight appointment, or the shipment would pass through several terminals before it arrives. Extra touches are where claims and accessorials pile onto the original rate.
Claims data shows why one percentage can mislead you. One 2025 shipper study reported damage or loss on 1.24% of LTL shipments, roughly one in 80, with an average claim of about $1,796, while another claims index reported the industry claims ratio falling from 0.588% in Q1 2020 to 0.345% in Q1 2025 (Freight Claims). Those figures use different denominators, so they cannot stand in for each other. Filling a trailer that would otherwise run light can lower emissions per shipment, but a cleaner move is not automatically the cheaper one once claims and accessorials sit in the total.
Score the choice on cost per delivered unit, claims cost and how often the freight is handled. A fuller trailer is only one input.
What a scheduled middle-mile route looks like
A scheduled route trades the freedom to add a random stop for the same path every night. It works like a bus line: the departure is set, the stops are facilities, and nobody rebuilds the sequence at the dock. Peak Transport runs overnight box-truck routes between warehouses, hubs and distribution centers. Routes are planned in advance, and data modeling cuts mileage and fuel use. Drivers go facility to facility, finish the shift and go home. They do not string together residential stops. On a lane you run every night, that repetition removes the terminal hops that make shared freight risky.
It fits fixed, repeatable lanes. Occasional freight still belongs on a shared trailer.
Before the first tender, get four items in writing: a confirmed departure cut time; who gets the call, and how fast, when a load misses that window; an accessorial schedule, because a dedicated route still bills extras the same way an LTL carrier does; and a claims process that names the photo requirement, the notice window and the settlement terms.
Then compare. Take your five busiest lanes and price consolidated LTL against a scheduled route on delivered cost: linehaul, density-driven class changes, accessorials and claims. Pick the option with the lower delivered cost and fewer exceptions. Shared-trailer freight stops paying off once those extras erase the quote gap, and this comparison of when truckload beats LTL walks through that crossover.
Peak Transport moves freight on scheduled overnight box-truck routes between warehouses, hubs and distribution centers across the Twin Cities metro. Dispatch is planned in advance, and routes are modeled to cut mileage and fuel. If your lanes need a departure window that holds instead of a quote that changes after delivery, visit Peak Transport to see how the routes run and which lanes are open.