Route Optimization Benefits Explained with Real Numbers
Route optimization benefits for middle-mile carriers: mileage, fuel, on-time performance, driver hours and the KPIs that prove ROI, with real figures.
October 26, 2026

Relaxing a one-hour delivery window to five hours was estimated to enable approximately 25% savings in mileage and cost, according to the World Business Council for Sustainable Development Road Freight Lab report. That single finding reframes route optimization benefits. The biggest gains don't always come from finding a shorter road. They come from coordinating appointment windows, driver hours, vehicle capacity and dock timing so a lane arrives on time, every night, at a lower cost per completed lane.
Route Optimization Benefits at a Glance
Route optimization delivers measurable gains in operating cost per lane, miles and energy use, fleet size, fuel spend, on-time arrival rate and vehicle utilization. The same Road Freight Lab benchmark modeled an average 12.5% reduction in transportation energy use and emissions from route and asset optimization. Treat that average as a starting estimate, not a promise, because reported savings ranged from 3% to 40% depending on the operating model.
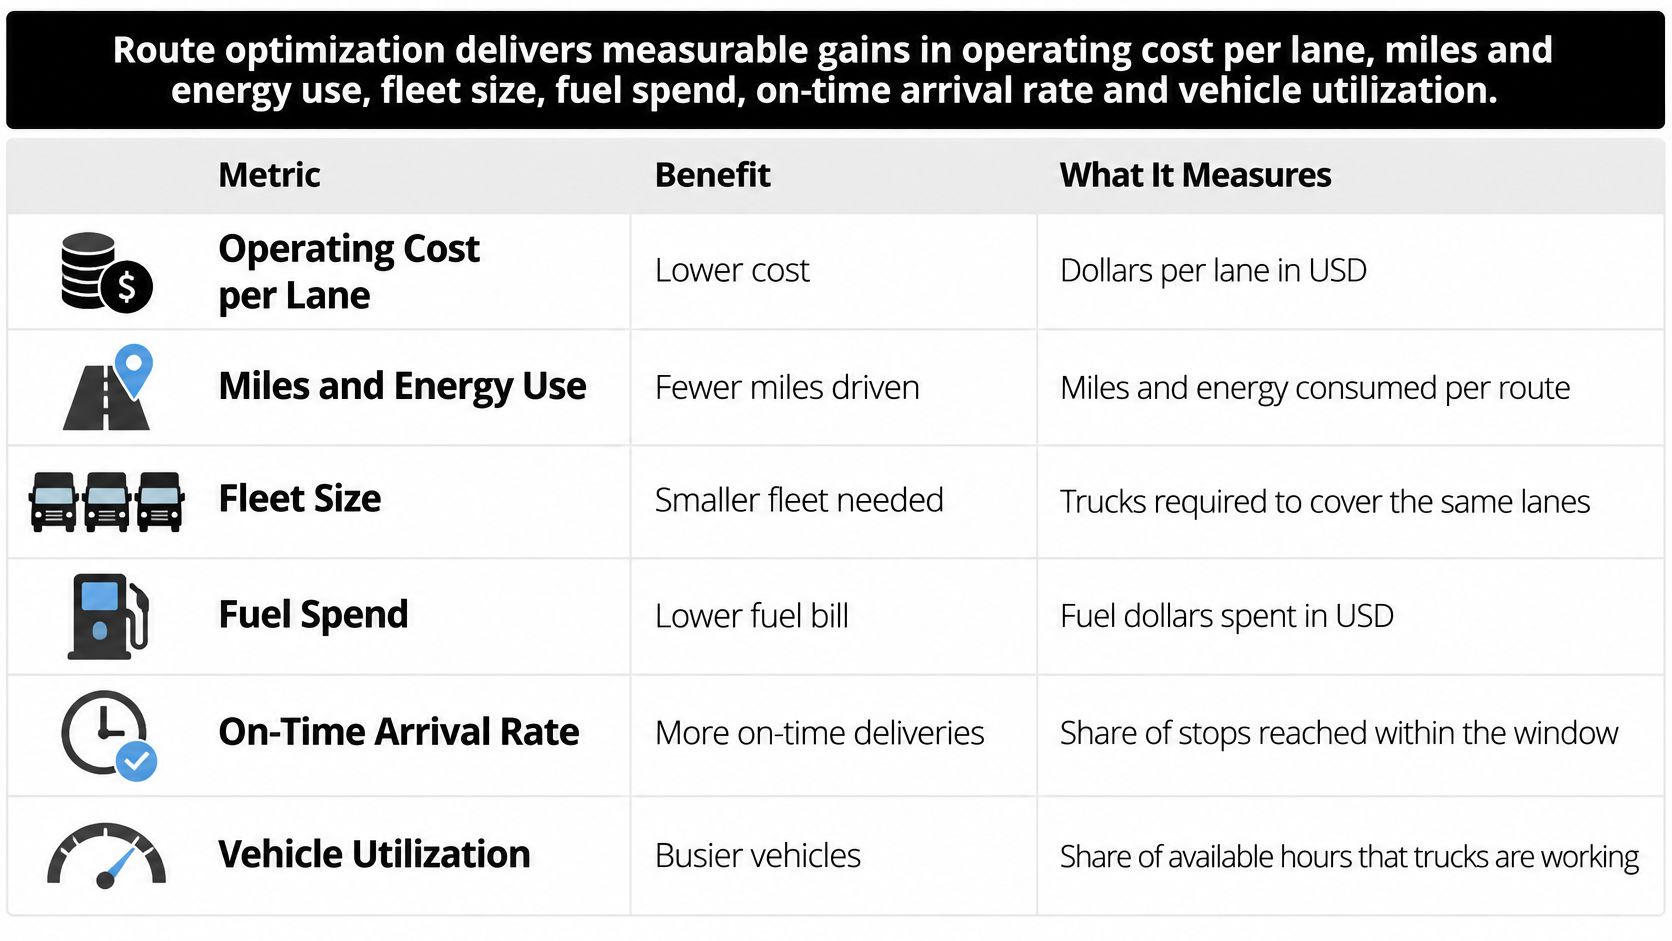
The table below separates what operators reported from what case studies measured, so you can compare each figure against your own baseline instead of copying it onto your lanes.
Route Optimization Benefits, Metrics and Reported Figures
| Benefit | Metric to Track | Reported Figure |
|---|---|---|
| Lower operating cost | Cost per completed lane | 58% of operators using computerized routing reported lower operating costs |
| Less mileage and energy use | Vehicle-miles and gallons | 12.5% modeled average, range 3% to 40% |
| Smaller fleet | Trucks required | 38% fleet reduction in an EPA distribution-network case study |
| Lower fuel spend | Fuel cost per lane | 38% of operators reported reduced fuel costs |
| Higher on-time rate | On-time arrival percentage | 96% on-time performance improvement in a documented example |
| Better vehicle use | Loaded-mile share | Loaded-mile share rose from 57% to 66% in a U.S. Forest Service study |
| Schedule resilience | Savings from wider appointment windows | About 25% savings when a one-hour window becomes five hours |
How to Read These Numbers
Adoption is still uneven. That benchmark found approximately 85% of fleet operators had not yet adopted top-tier asset-optimization tools at the time of the study. A carrier that builds disciplined, constrained planning now can still differentiate on reliability, not just price.
Read the ranges by your role. If you're paid per lane, watch cost per completed lane and fuel per completed lane first. If you're buying capacity for a hub network, watch on-time arrival rate, schedule stability and missed cutoffs first, because a cheap lane that arrives after processing starts isn't cheap at all.
Analyst rule: A benefit counts only when the metric moves on completed lanes. Planned miles saved on a screen don't pay a fuel bill.
How Route Optimization Turns Lanes Into a Plan
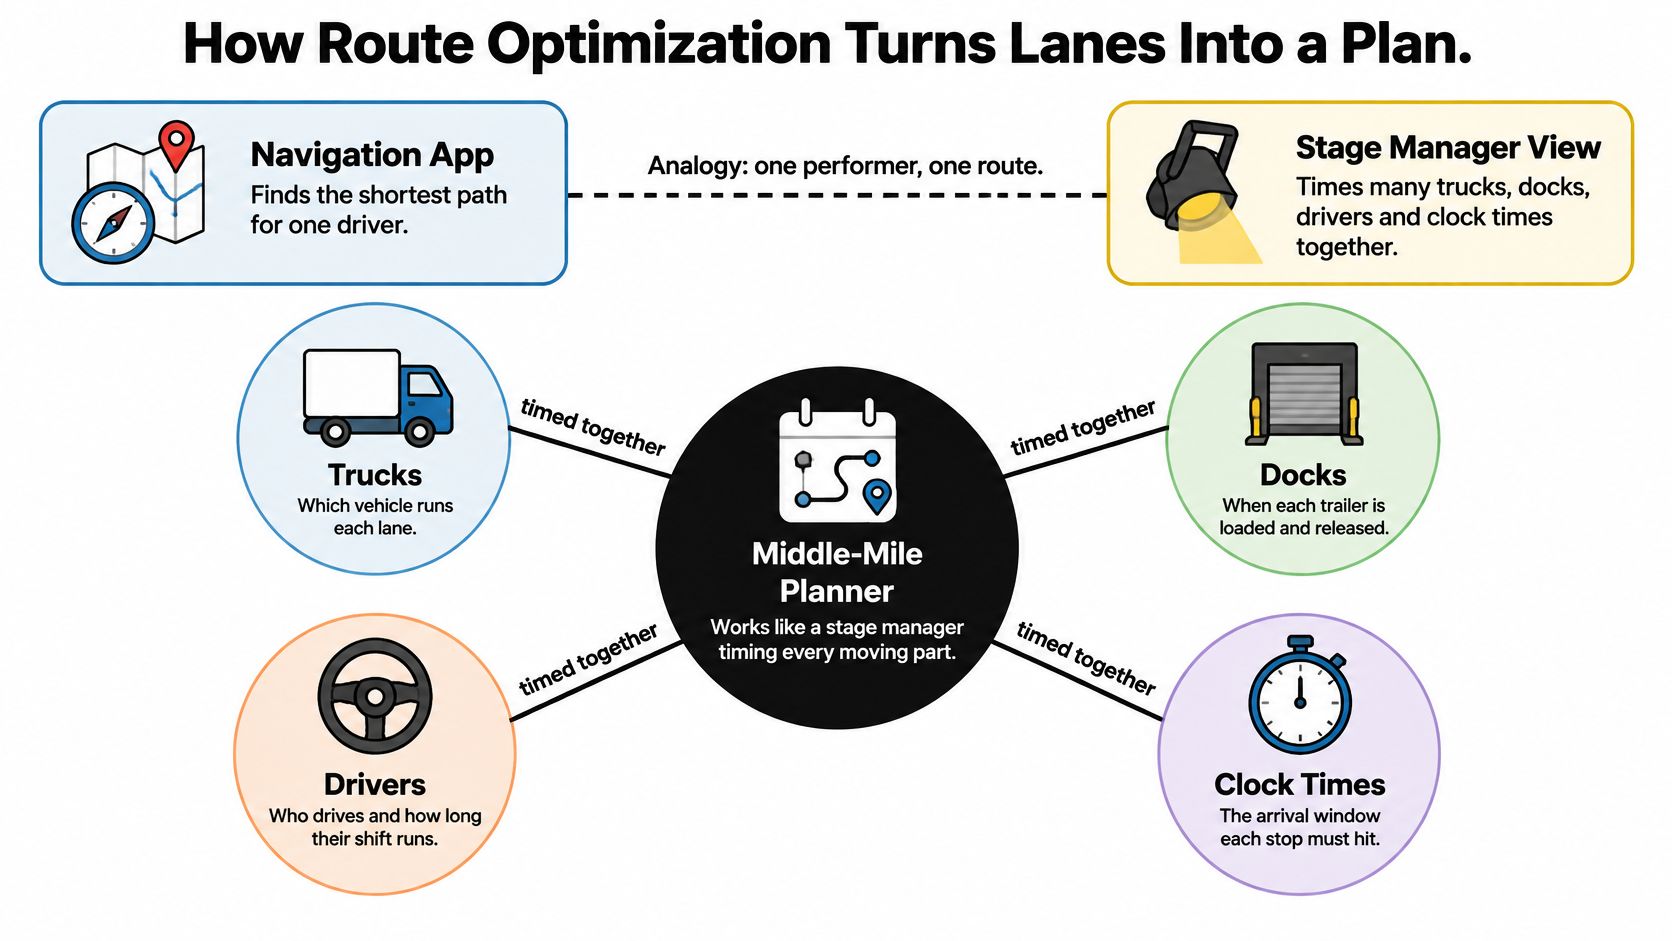
A navigation app solves one problem for one driver. It finds a path. A middle-mile planner works like a stage manager timing many trucks, docks, drivers and clock limits so every cue lands in sequence. One late release, one slow gate entry or one driver running short on hours can break the next three moves.
The image below shows that stage-manager view, with trucks, docks, drivers and clock times timed together rather than routed in isolation.
The underlying model is the capacitated vehicle-routing problem that George Dantzig and John Ramser framed in 1959 through a gasoline-truck dispatching application, as described in the U.S. Forest Service coordinated-trucking research record. In plain terms, you assign stops to vehicles, respect capacity and minimize total travel.
Inputs a Usable Overnight Model Needs
- Dock appointment windows: When each facility will receive, load and release the truck
- Vehicle capacity: Cube, weight and load compatibility for the assigned box truck
- Shift length and breaks: Planned duty time that leaves a legal buffer
- Loading and unloading time: Real dwell, not the optimistic number on a rate sheet
- Parking and vehicle restrictions: Legal routes, height and weight limits, and safe stopping options
- Processing cutoff: The time the next node must have freight to keep its sort on schedule
This short video walkthrough shows how those moving parts fit together in a single planning view before dispatch commits a driver to the lane.
The Chain of Effects
Start with a fixed lane schedule. Apply constrained optimization to departures, transfers and returns. That reduces empty repositioning moves, raises the share of miles run loaded, and steadies arrival times at the receiving dock. Drivers get repeatable instructions instead of nightly improvisation.
Optimization produces a repeatable operating plan, not a single map route. That's the difference that matters on recurring overnight lanes.
What Measured Results Look Like on Real Routes
Start with fleet size, because it's the result operators feel fastest in capital and staffing. A U.S. Environmental Protection Agency case study reported that redesigning a distribution network reduced fleet size by 38%, according to the case summary in SpringerLink's logistics network chapter. Fewer trucks covering the same work means each remaining truck runs more productive hours, provided service doesn't slip.
A second documented example in that same summary eliminated 400,000 annual travel miles, removed two to three routes per day, and improved on-time performance substantially alongside those cuts. Those results belong together. Removing routes only helps if arrivals improve or hold steady, and in this example reliability rose while mileage fell. Judged by completed on-time lanes rather than miles avoided, the network got faster by carrying less deadhead, not by driving harder.
Converting Miles Into Fuel
The fuel math is straightforward. Using that source's assumption of 6.5 miles per gallon for tractor-trailer equipment, 400,000 miles equals approximately 62,000 gallons of fuel saved annually. You can run the same division on your own lanes with your own equipment's actual consumption.
Don't copy tractor-trailer figures onto box trucks. Box trucks differ in fuel economy, duty cycle, idle time and urban exposure. Translate the logic instead. Measure your current gallons per completed lane, model the mileage and idle time you can remove, then verify the change with fuel card and telematics data after dispatch.
A documented gain transfers as a method, not as a number. Your baseline decides what the same method is worth on your network.
An Illustrative Overnight Box-Truck Lane
Say a carrier runs a hypothetical 40-mile overnight lane six nights a week between two hubs. The planner finds that one intermediate stop and a long dwell period are artifacts of an old schedule, not current freight needs.
- Current input: One 40-mile run, one extra stop, and a 25-minute dwell at the hub before release
- Change made: Remove the stop, move departure earlier, and sequence loading so the truck clears the dock without waiting
- Output to check: The same truck finishes early enough to cover a second short lane before the next node's processing cutoff
- Guardrail: The driver's planned shift still ends with break time and an hours-of-service buffer intact
The road between the hubs never changed. The gain came from synchronized departure, transfer and return timing, which let the same equipment and labor pool cover more productive work. A shorter route on the map would have done nothing here; the stop was already on the way, and the wasted minutes were spent parked at the dock. On overnight hub operations, a small dwell improvement can decide whether freight makes the cutoff or waits a full cycle.
That's the pattern across the documented examples. The winning routes weren't the shortest ones. They were the ones that arrived inside the window, kept the driver inside legal hours, and left enough slack to absorb a bad night without failing the lane.
KPIs That Prove Route Optimization Is Working
Judge a route by cost per completed lane, on-time probability and hours-of-service buffer, not by miles. Miles are an input. A completed, on-time lane inside legal hours is the product you're selling. Any scorecard that rewards miles alone will eventually reward a route that fails at the dock.
The technical reason is the objective function. A realistic model jointly weighs driver time, fuel, tolls, late-arrival penalties and compliance risk, and the weighting decides what "good" means before a single stop is sequenced. Routing research built around fuel and emissions shows how sensitive that weighting is: studies in that line of work have reported emissions reductions alongside some scenarios where trip duration and cost went up. A model tuned only for fuel will trade away arrival reliability without making that visible. Ignore one cost in the weighting and the model optimizes the wrong thing confidently.
Route Optimization KPI Scorecard
| KPI | How to Measure | Sign of a Working Route |
|---|---|---|
| On-time arrival rate | Arrivals inside the appointment window divided by total arrivals | Stays above the facility threshold on every lane |
| Cost per completed lane | Fuel, driver time, tolls and penalties divided by lanes completed | Falls without a rise in late arrivals |
| Hours-of-service buffer | Legal drive and duty hours minus planned hours | Stays positive on the heaviest day of the week |
| Empty-mile share | Miles without cargo divided by total miles | Declines week over week |
| Preventable detention | Minutes held beyond free time per stop | Near zero at recurring docks |
| Safety events | Recorded safety events per completed lane from telematics and incident logs | Flat or falling after route changes |
| Dispatcher interventions | Manual route changes per shift | Declines as lanes stabilize |
Baseline First, Then Weekly Tracking
Collect four to six weeks of current data before you change anything. Use the same lane definitions, clock sources and cost categories you'll use after the change. Then track each KPI weekly by lane, not just as a network average, because averages hide the one lane that's failing without anyone noticing.
Two of these KPIs do work the others can't. The hours-of-service buffer tells you whether a plan survives its worst day, since a lane that's legal Monday through Thursday and short on Friday is a compliance problem with a schedule. Dispatcher interventions measure model quality directly: every manual override is a constraint the software didn't know about.
Finance teams should connect lane KPIs to working capital too, since reliable inbound timing affects how much stock a hub must hold. AmbitionCFO's guide to measure inventory's impact on cash flow is a useful companion when you translate arrival reliability into inventory terms. For a broader set of operating measures to pair with this scorecard, see this overview of logistics performance metrics for middle-mile carriers.
Before you compare any model output with current performance, load the constraints. Maximum shift duration, required breaks, facility appointment windows, legal vehicle restrictions and contingency slack must be in the model first. A plan that wins only by assuming away a break or a dock window hasn't won anything.
Diagnostic signal: A rising count of dispatcher overrides signals a missing constraint, not a dispatcher problem. Log the override reason and fix the model input that caused it.
What Route Optimization Costs and Returns
The cost side has three parts, and only one of them is software. You'll pay routing software or licence fees, planner time to build and maintain lane constraints, and labor for the baseline period and parallel run when the new plan operates beside the old one. Skipping the constraint-building work is the most common false economy, because dispatchers then repair the output by hand every night.
What Operators Report on the Return Side
Among operators using computerized vehicle-routing systems in the benchmark cited earlier, 58% reported lower operating costs, 38% reported reduced fuel costs and 29% reduced fleet size. Read those as shares of operators who saw improvement, not as the size of the improvement. Your return still depends on how much waste your current lanes contain.
Fuel is usually the easiest return to verify, since gallons per completed lane shows up in fuel card data within weeks. This guide on how to reduce fuel consumption on recurring truck lanes covers the operating habits that support the routing gains. Fleet reduction pays back more slowly, because you only bank it when a truck is redeployed, a lease isn't renewed or a planned purchase is cancelled.
The Payback Calculation
Use a simple formula a planner can run in a spreadsheet.
- Payback period: Implementation cost divided by monthly net savings
- Monthly net savings: Fuel, driver time, detention and penalty savings, minus added tolls and any extra late-arrival cost
- Denominator rule: Count savings per completed lane against your baseline, never against a vendor mileage claim
Here's a clearly hypothetical example. Say setup, software and planner time cost $30,000, and two overnight box-truck lanes produce $5,000 in verified monthly net savings. Payback is about six months. Change either number and the answer changes, which is exactly why the baseline matters more than any brochure percentage.
Apply one hard test before you book the return. A change that lowers cost per lane but raises late arrivals fails, because penalties, missed cutoffs and recovery freight will consume the saving. Report return as cost per completed lane tracked alongside on-time rate. If both move the right way together, the gain is real.
Driver Hours, Safety and When Shorter Routes Fail
Optimization should affect drivers first by making work more predictable and safer, with productivity treated as a secondary outcome. A recent logistics report found 51% of logistics companies had adopted route-optimization software and 87% reported that it helped operations, while also linking more efficient routing with lower fatigue risk, according to Tech.co's report on logistics technology adoption. That report offers limited independent evidence connecting software adoption directly to fewer crashes or fatigue-related incidents. Employers shouldn't assume the safety benefit. They should measure it.
Measure paid hours, schedule stability, break compliance, late-night workload, driver turnover, safety events and last-minute route changes. If miles per truck improves while last-minute changes climb, the plan is transferring cost onto drivers. For the legal frame behind shift planning, Patriot CDL explains how the 14-hour driving window works, and this breakdown of hours-of-service rules for box-truck drivers applies those limits to overnight schedules.
The Trade-Off That Decides the Driver Benefit
Every saved minute can be spent two ways. You can bank it as buffer for traffic, breaks and dock delays. Or you can spend it on higher utilization, adding work until the schedule is tight again. The first choice protects drivers and cutoffs. The second erodes the benefit that optimization created, one added stop at a time.
When Optimization Makes a Route Worse
A route gets worse when the model lacks operational constraints or optimizes one narrow KPI. Recent industry coverage claims advanced routing can reduce miles by 10% to 30% and improve fleet utilization by 15% to 30%, but those figures are generally vendor-reported and shouldn't be treated as universal benchmarks, as noted in Locus's overview of route optimization. Watch for these failure patterns.
- Slower urban streets: Fewer miles, more minutes, more stop-and-go fatigue
- Difficult facility approaches: Tight gates or awkward dock angles that generic maps don't capture
- Thin buffers: One late dock pushes arrival past the processing cutoff
- Ignored local knowledge: Gate order, loading sequence and yard habits that drivers know and models don't
On recurring overnight lanes, a slightly longer route that arrives on time every night beats a shorter one that misses one cutoff in five.
Keep human review, documented exceptions and a driver feedback loop in place after launch. When a driver reports that a gate opens late or a street floods after rain, that exception goes into the constraint list, not into a dispatcher's memory. The payoff that drivers feel most directly is a consistent route, a predictable weekly schedule and fewer surprise reroutes.
Confirm the Benefits on Your Lanes Before You Commit
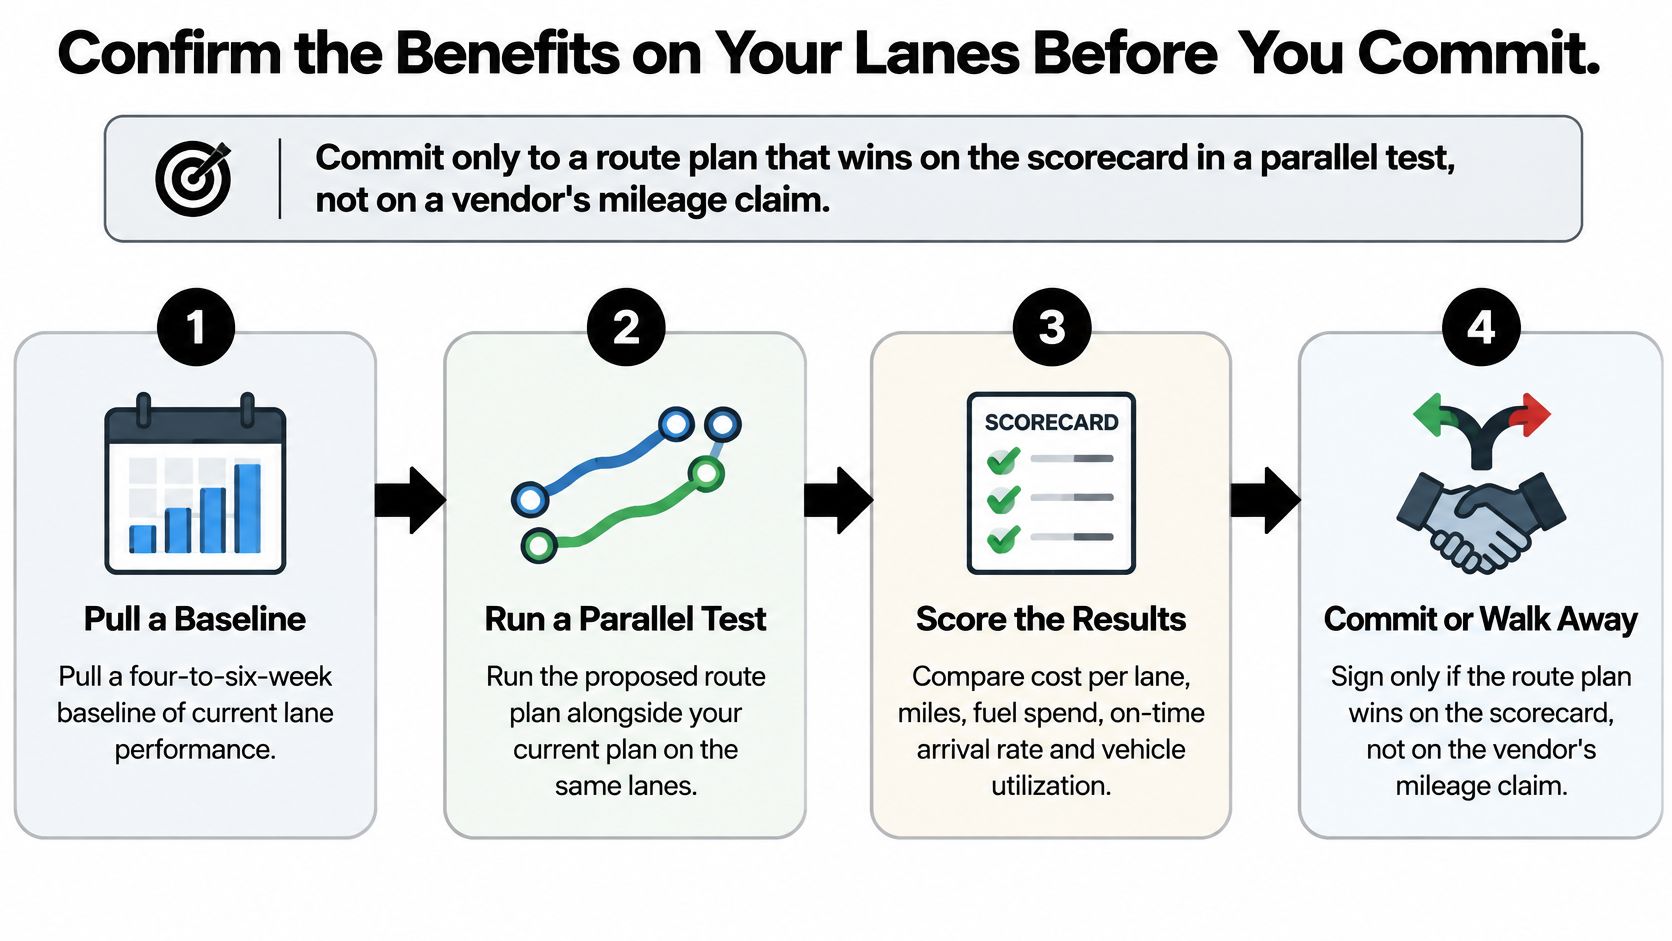
Commit only to a route plan that wins on the scorecard in a parallel test, not on a vendor's mileage claim. Vendors such as OnFleet and Routific, and carriers that run engineered overnight lanes such as Peak Transport, should all face the same test on your freight, your docks and your clock. The procedure below gives you that test in seven steps.
The process image below summarizes the decision flow, from baseline to a commit or walk-away call based on scorecard results.
The Seven-Step Parallel Test
- Pull a four-to-six-week baseline. Record on-time rate, cost per completed lane, empty-mile share and hours-of-service buffer for every candidate lane.
- Pick two or three recurring overnight lanes. Choose lanes with stable facilities and repeatable freight, so week-to-week comparison means something.
- Enter every constraint. Load shift length, required breaks, dock windows, vehicle restrictions and contingency slack before the model runs.
- Run the optimized plan beside the current plan for four weeks. Keep freight, staffing definitions and clock sources consistent across both.
- Compare the scorecard and log every dispatcher intervention. Each manual change gets a reason code, so you can tell a missing constraint from a genuine disruption.
- Set guardrails the plan may not breach. Fix a minimum hours-of-service buffer and an on-time floor in advance, while you're still objective.
- Review driver feedback, then scale only the lanes that pass. A lane that wins on cost but draws consistent driver safety concerns doesn't scale until the concern is resolved.
Why Each Step Earns Its Place
The baseline stops you from crediting the software for a quiet freight week. Stable test lanes stop facility changes from contaminating the comparison. The intervention log is your diagnostic record, because repeated overrides at the same dock point to a bad dwell assumption or a wrong appointment window in the model.
Guardrails deserve emphasis. Decide them before results arrive, not after a vendor shows you an attractive mileage chart. If the optimized plan breaches the on-time floor, it fails even if cost per lane drops. That discipline is what separates an engineered lane network from a nightly negotiation between dispatch and the map.
Driver feedback closes the loop that data alone can't. Telematics will show a slow segment. Only the driver can tell you it's slow because the gate guard processes one truck at a time after midnight. Feed that fact back into the constraint list and rerun the lane before you judge it.
Shippers can apply the same standard when selecting a carrier. Ask any carrier, Peak Transport included, for these KPIs by lane and by period before signing. A carrier that runs engineered lanes can produce on-time rate, cost drivers, empty-mile share and hours-of-service discipline in a consistent format. A carrier that can't produce them is asking you to buy the mileage claim this test is designed to replace.
Peak Transport runs structured overnight box-truck lanes between Twin Cities distribution centers and regional hubs, using data-informed route planning to protect driver hours and on-time arrivals. If you want lane-level KPIs before you commit freight, or consistent W-2 overnight work as a driver, visit Peak Transport to see current lanes and openings.