Supply Chain Planning Guide for Middle-Mile Operations
Master supply chain planning for distribution hubs with practical steps, KPIs, and tips for selecting reliable middle-mile partners like Peak Transport.
October 5, 2026
A distribution center can have a reasonable forecast, enough inventory on paper, and contracted transportation capacity, yet still miss the customer promise. A late inbound trailer changes dock availability. A congested middle-mile lane pushes dispatch beyond driver hours. Sales adds an urgent order after the plan is frozen, and the warehouse team spends the night rebuilding routes in a spreadsheet.
That is where supply chain planning earns its keep. The useful plan isn't the one with the prettiest dashboard. It's the one that tells people what to do when demand, inventory, labor, and transportation stop lining up. For middle-mile operations, that means treating planning as an operating discipline built on clean data, clear decision rights, and an honest understanding of what the network can execute.
What Supply Chain Planning Actually Means for Distribution
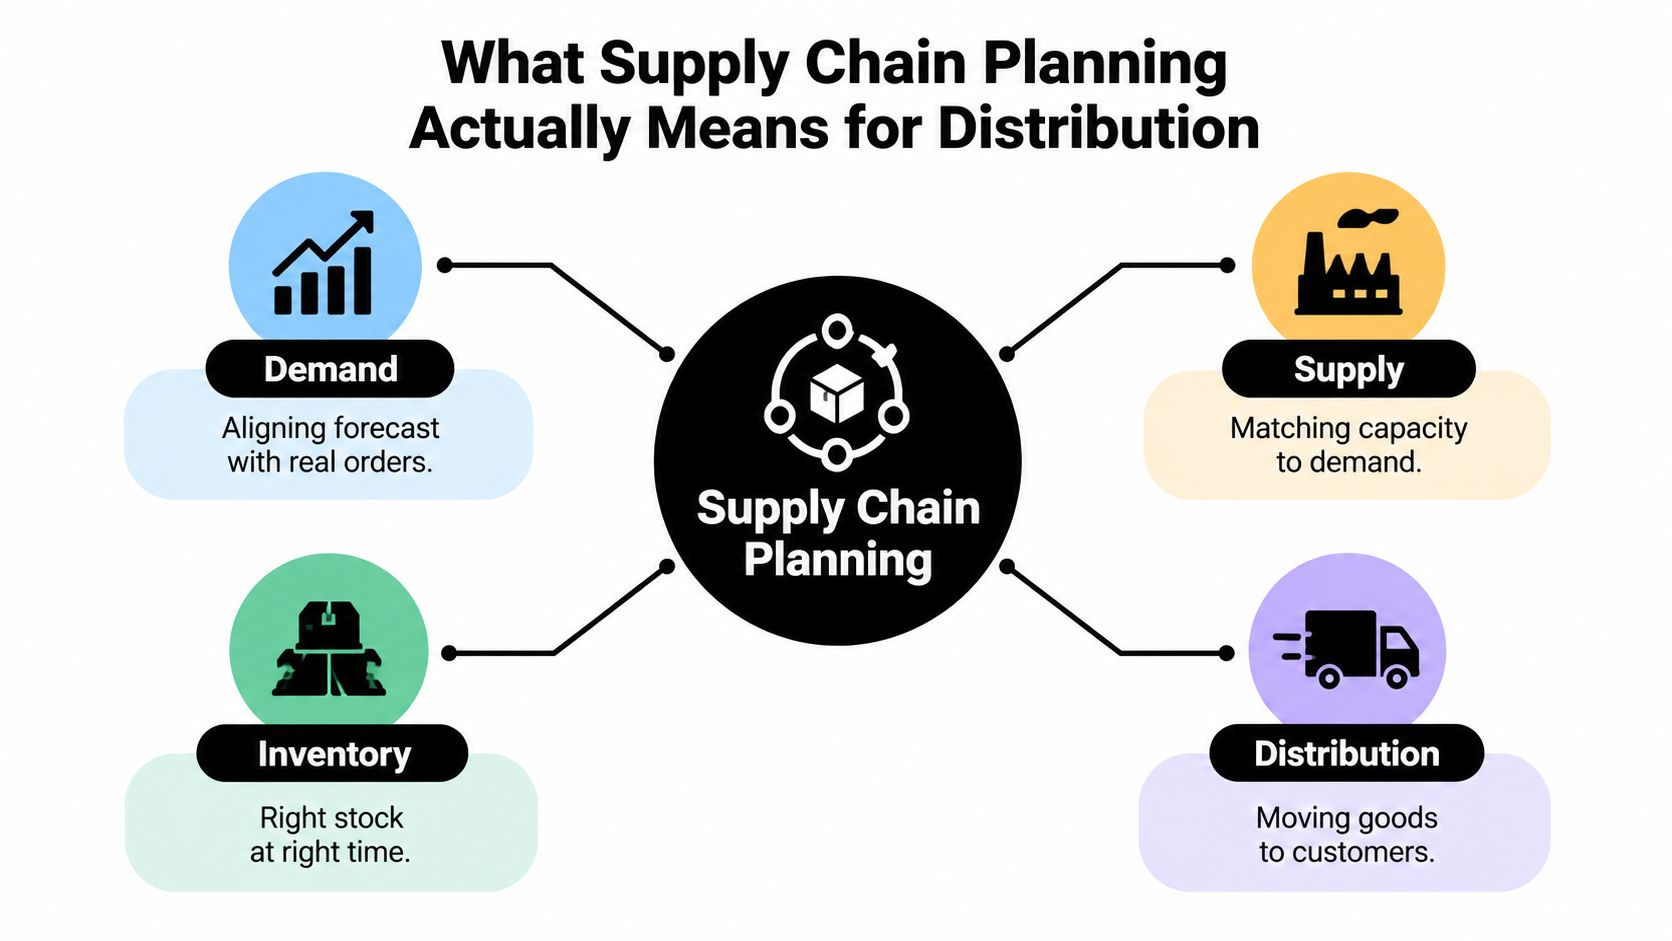
Supply chain planning is the disciplined alignment of demand, supply, inventory, and distribution so a business can meet customer commitments without creating avoidable cost. In a distribution environment, that alignment has to survive contact with receiving appointments, dock capacity, trailer availability, route density, driver schedules, and cut-off times.
A forecast by itself doesn't move a carton. Inventory in the wrong facility doesn't protect a customer. A low-cost route that arrives after the receiving window isn't efficient. Planning becomes useful only when commercial assumptions are translated into executable decisions for warehouse and transportation teams.
Start with the physical flow
A practical planning cycle follows the product through four connected questions:
- Demand: What are customers likely to order, and what firm orders already exist?
- Supply: Can suppliers, facilities, labor, and carriers support that requirement?
- Inventory: Where should stock sit, and which items need protection from delay?
- Distribution: Which lanes, schedules, and handoffs can move the product within the promise?
The sequence matters, but the loop matters more. A demand change affects replenishment. Replenishment affects receiving labor. Receiving affects pick availability. Pick availability affects outbound waves and middle-mile departures.
Traditional models break down when they treat those changes as separate exceptions. A manager may see a transportation problem, while a buyer sees a supplier problem and a sales leader sees a service problem. The organization needs one operating picture, not four disconnected explanations. A useful overview of how visibility connects planning decisions with execution is available in this supply chain visibility resource.
Plan for ownership, not just software
Technology can calculate requirements, consolidate data, and surface exceptions. It can't decide whether sales may override a forecast, who approves an expensive recovery load, or which customer receives scarce inventory. Those are governance decisions.
This is also why planning deserves attention during organizational transactions. Anyone evaluating selling a distribution company should examine planning routines, master-data quality, carrier dependencies, and undocumented operating knowledge, not just facilities and equipment. A network's value depends partly on whether another team can understand and run it.
Practical rule: If a planner can't explain the operational action behind a system recommendation, the recommendation isn't ready for execution.
The Three Layers of Planning and Why They Interconnect
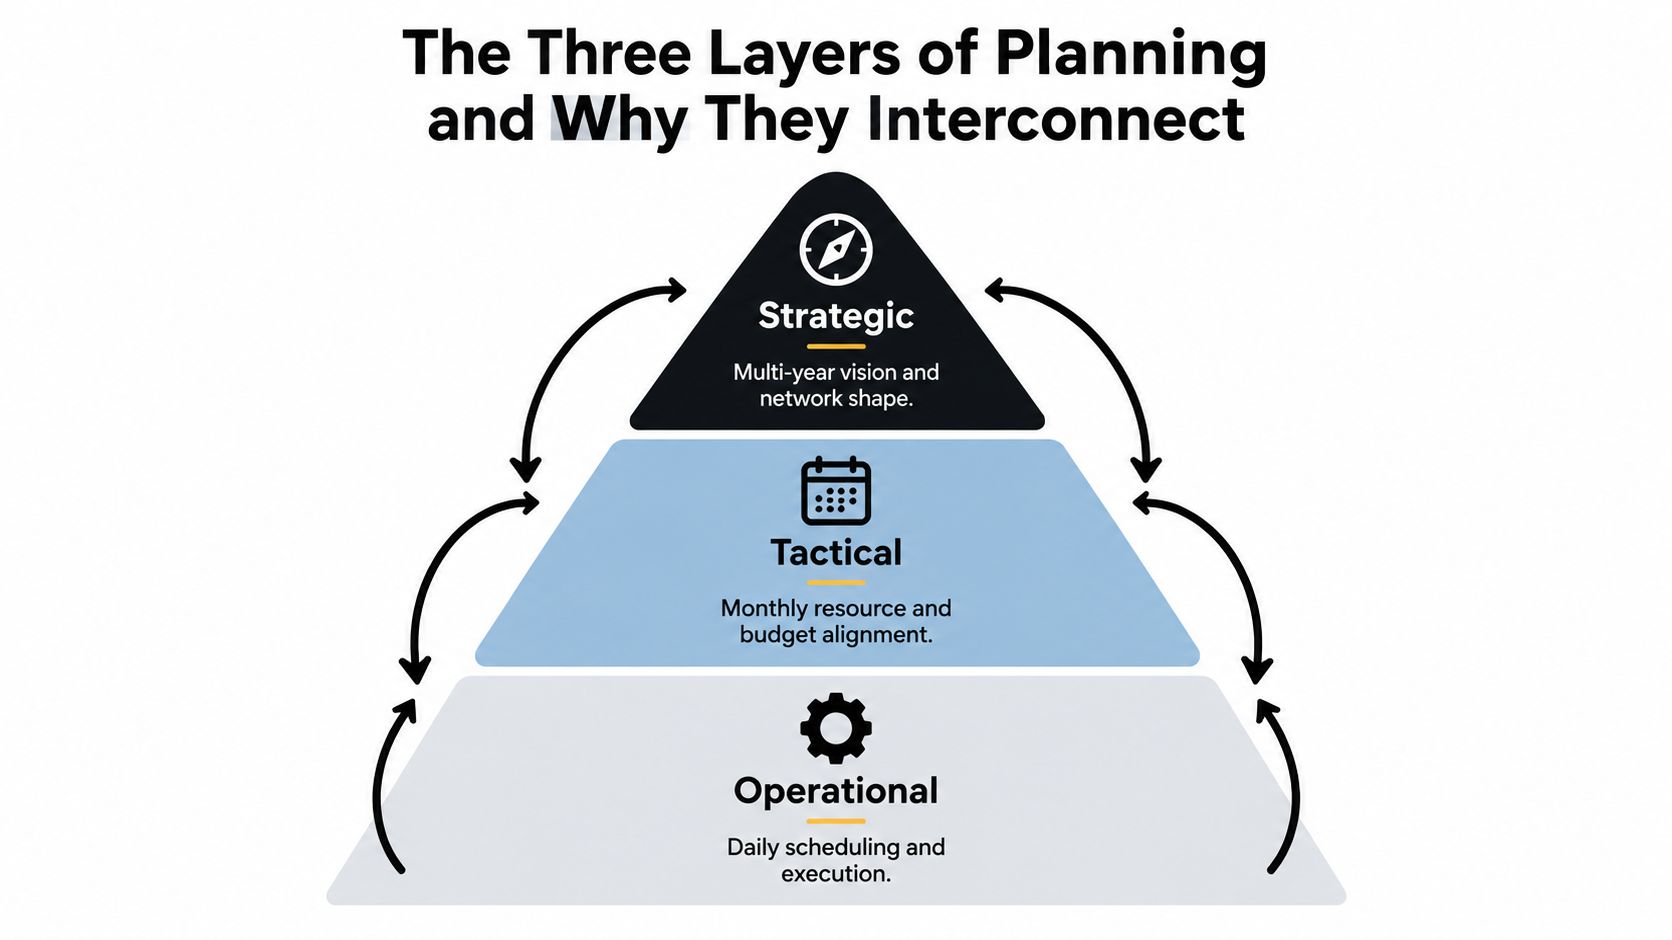
The three planning horizons have different time scales, but they share the same physical constraints. Strategic planning shapes the network. Tactical planning allocates resources within that network. Operational planning turns those decisions into today's loads, appointments, and dispatch instructions.
Strategic choices set the boundaries
Strategic decisions include facility locations, customer-to-node assignments, transportation modes, supplier concentration, and the role of each distribution center. These choices can remain in place for years, which makes weak assumptions expensive to unwind.
Suppose a network places a hub far from a major demand cluster because the building is inexpensive. The tactical team may compensate by holding more stock at that location, scheduling additional transfers, or paying for faster replenishment. The operational team then inherits fuller trailers, tighter dock windows, and more complicated handoffs.
Network design should therefore be tested against realistic lane behavior, not just average freight cost. This supply chain network design guide provides useful context for evaluating how facility and lane decisions shape execution.
Tactical decisions translate intent into capacity
Tactical planning works across a shorter horizon. Teams set inventory policies, arrange labor and carrier capacity, establish replenishment calendars, and reconcile commercial plans with warehouse limits. At this level, the organization decides whether it can support a promotion, absorb a supplier constraint, or change a delivery pattern without damaging another promise.
A tactical plan that ignores middle-mile capacity creates false confidence. The warehouse may have product available, but the carrier schedule may not have a workable departure. Conversely, a transportation team may reserve capacity for a volume assumption that sales no longer supports.
Operational planning closes the loop
Operational planning covers daily and near-term decisions, including wave timing, load sequencing, route assignments, appointment changes, and exception handling. It must react quickly without allowing every new request to rewrite the entire network.
The key is feedback. Operational results should challenge tactical assumptions, and tactical results should challenge strategic design. If a lane repeatedly requires manual recovery, leaders should ask whether the schedule, inventory position, cutoff, or network assignment is wrong. Optimizing one horizon in isolation moves the failure downstream.
The strongest planning teams don't treat these horizons as separate meetings with separate facts. They use common definitions for service, capacity, exceptions, and ownership, then let each horizon make decisions at its proper level.
Core Components That Drive Distribution Efficiency
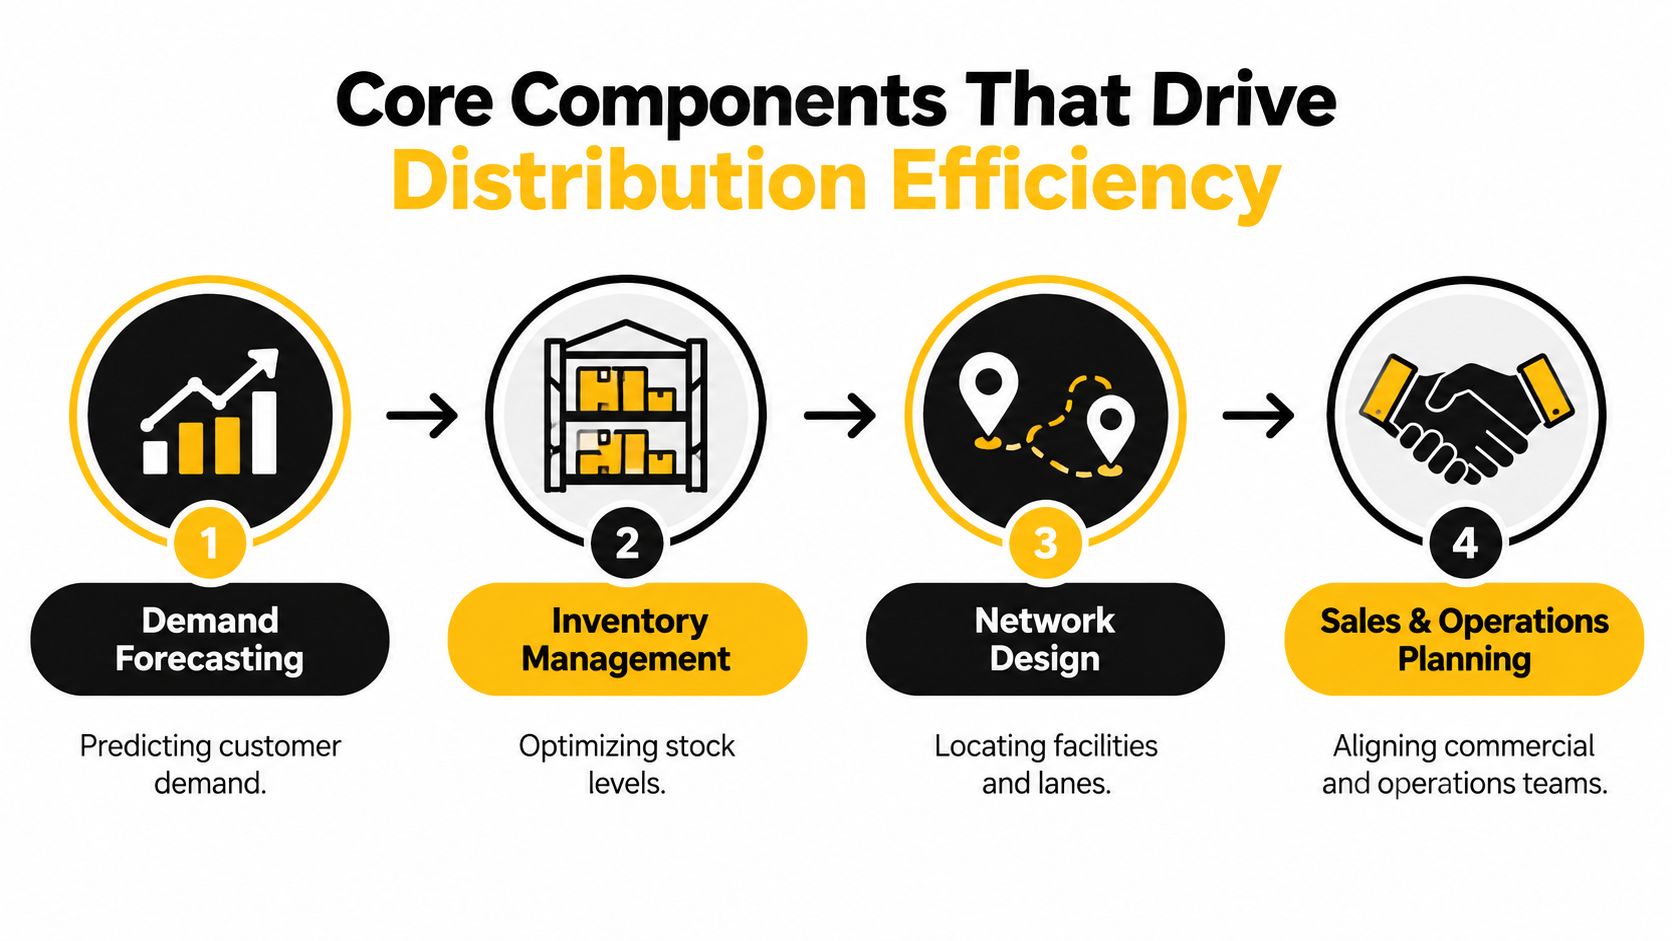
Four components determine whether a distribution plan can support throughput: demand forecasting, inventory management, network design, and Sales and Operations Planning. Each one answers a different question, but the decisions are interdependent.
Forecast demand at the level people can act on
Forecasting should distinguish between a stable, high-volume product and an intermittent SKU-location combination. A single accuracy target across every item encourages planners to hide poor performance in aggregation or overreact to noisy demand.
For short-term forecasts, many procurement organizations target MAPE between 10% and 20%, while monthly product-family views can show WAPE around 15% to 30%. SKU-location forecasts by week often fall between 30% and 60%, according to Amazon's demand forecasting guidance. Those ranges aren't excuses for weak forecasting. They are a reminder to set useful expectations by horizon, volume, and volatility.
Position inventory around the promise
Inventory management isn't just a question of how much stock the business owns. The harder question is where that stock sits relative to demand and replenishment risk. A regional hub may have enough total units but still fail because the required item is trapped at the wrong node.
Planners should connect reorder points, safety stock, transfer rules, and customer priority to actual lead-time behavior. The policy must also state who can override it and what evidence the override requires. Otherwise, inventory decisions become a series of undocumented reactions.
Design the network for handoffs
Network design determines how far product travels, how often it changes hands, and how much schedule coordination each order requires. A facility location that looks efficient in a model may create awkward middle-mile timing if inbound and outbound windows don't align.
Use lane history, receiving constraints, trailer utilization, and route density when testing alternatives. A network with fewer facilities isn't automatically simpler if every node depends on urgent transfers.
Use S&OP as a decision forum
S&OP should be the recurring mechanism that resolves conflicts between sales ambition and operating capacity. It needs more than a forecast review. Participants should decide which demand is funded, which constraints are accepted, what inventory will be repositioned, and which customer commitments need escalation.
A transportation management system can support those decisions by improving planning visibility and execution control. Teams assessing cloud-based TMS software should ask whether it connects planning assumptions to dispatch actions, rather than just adding another reporting layer.
The Hidden Danger of Biased Demand Forecasts
Forecasting errors don't come only from weak algorithms. They also come from the people who adjust the output, the incentives behind those adjustments, and the signals the organization chooses to believe.
A 2015 multi-company study collected more than 12,000 forecasts and outcomes across four firms and found that commonly used judgmentally adjusted forecasts were both biased and inefficient, as documented in the Lancaster University research record. The researchers also observed that planners used market intelligence about negative demand signals far more effectively than positive signals.
That finding matters in a hub operation. If planners quickly reduce expected demand after a weak signal but hesitate to increase it after a strong one, the business can build a structural imbalance. The result may be excess stock in one category, insufficient stock in another, and transportation plans that keep changing because the baseline never stabilizes.
Control the override habit
Judgment is valuable when it adds information the model can't see, such as a confirmed customer launch, a cancelled promotion, or a known competitor exit. Judgment becomes dangerous when it reflects optimism, fear, sales pressure, or a planner's desire to explain every fluctuation.
A sound override process should require three things:
- A named reason: Record whether the change reflects a promotion, customer commitment, supply constraint, one-time event, or data correction.
- An accountable owner: The person changing the forecast should be identifiable, and the commercial or operational source should be clear.
- A review condition: Define when the assumption will be checked against actual orders and removed if it no longer applies.
A practical guide to demand forecasting can help teams compare forecasting methods, but method selection won't solve a governance problem. The organization must decide when human input improves the plan and when it merely introduces bias.
Build trust through visible evidence
Leaders often distrust models because the inputs are unclear or the system can't explain a recommendation. Planners distrust leadership because overrides arrive without consequences or documentation. Both problems improve when teams publish the assumptions behind the plan and review forecast error by segment, not just as one blended score.
The answer to distrust isn't forcing everyone to accept an opaque forecast. It's creating a controlled challenge process. Sales can challenge the demand signal, operations can challenge the capacity assumption, and finance can challenge the cost implication, but each challenge should produce a recorded decision.
Measuring Success with the Right KPIs for Middle-Mile
A low planning cost can look efficient while service deteriorates. A high on-time rate can hide excessive premium freight. A strong forecast score can say little about whether the warehouse can load the planned volume during the available window.
Middle-mile leaders need a balanced scorecard that connects planning quality to execution. The APQC supply chain planning measure list includes measures such as planning FTEs per $1 billion in revenue, forecast accuracy, production schedule adherence, and total planning cost per $1,000 of revenue. These measures are useful only when read together.
Compare efficiency with service
| KPI family | What it reveals | What it can hide |
|---|---|---|
| Forecast accuracy | Whether the demand signal is useful at the selected level | Aggregation can conceal poor SKU-location performance |
| Schedule adherence | Whether planned work is completed as intended | The schedule itself may be unrealistic |
| Planning cost | Whether planning resources are being used carefully | Cutting planners can weaken exception management |
| On-time departure and arrival | Whether freight follows the operating promise | Teams may protect the metric with costly expedites |
| Route and trailer utilization | Whether capacity is positioned effectively | High utilization can leave no recovery room |
The right question isn't which KPI wins. It's whether the set shows the trade-off between cost, cycle time, service, and resilience. A carrier that fills every trailer but misses receiving windows isn't creating useful efficiency. A team that protects every service promise with premium moves may be shifting cost rather than solving the plan.
Measure volatility as a planning input
A 2025 global benchmark reported that lead-time swings affected 29% of respondents, raw-material cost changes affected 23%, freight and shipping affected 22%, and demand shifts affected 21%. The supply chain planning report also found that 24% of small and midsize businesses reported more than 10% of inventory as dead stock, compared with 12% in 2024.
Those figures show why static targets fail under changing conditions. The planning team should track which assumptions move most often, how quickly the operation detects the movement, and what action follows. A volatility dashboard is valuable only when it triggers a decision, such as rebalancing inventory, changing a departure pattern, or escalating a capacity risk.
Don't reward firefighting
If planners receive praise for saving late loads, they may tolerate poor master data and weak cutoffs. Include leading indicators such as exception age, unconfirmed appointments, manual overrides, and unresolved data defects. These measures expose the conditions that create tomorrow's service failure.
How to Select a Reliable Middle-Mile Partner
A middle-mile carrier should be evaluated as part of the planning system, not as a replaceable line on a freight bid. The carrier receives the consequences of forecast changes, dock delays, poor load sequencing, and unrealistic appointment promises. If its operating model depends on improvisation, the shipper inherits that instability.
Start with an operational audit before discussing price. Ask the carrier to explain how it builds routes, handles a missed pickup, communicates a changed stop, documents a load, and escalates a safety issue. You should see evidence of repeatable decisions, not just confident answers.
Test planning maturity in the field
A reliable review includes:
- Route logic: Can dispatch explain lane structure, stop sequence, equipment constraints, and recovery options?
- Driver model: Does the company maintain a stable, trained workforce with clear accountability?
- Communication: Can warehouse teams reach dispatch quickly and receive one consistent instruction?
- Documentation: Are bills of lading, scan events, exceptions, and proof of delivery handled accurately?
- Safety controls: Does the carrier treat compliance as an operating requirement rather than a presentation topic?
- Systems integration: Can the partner exchange the shipment, status, and exception information your team needs?
The distinction between contractors and employees deserves direct attention. Peak Transport uses W-2 drivers, paid training, structured overnight schedules, and documented dispatch processes for middle-mile box-truck operations in the Twin Cities area. That model is one example of how a carrier can build consistency through defined employment, training, and communication practices.

Price the failure mode, not just the lane
A low linehaul rate can become expensive when the carrier misses a hub cutoff, creates detention, sends incomplete status data, or forces a planner to rebuild the next move. Compare partners on total operating impact, including schedule consistency, exception response, safety performance, documentation quality, and integration effort.
Teams that work with forwarders may also benefit from a structured Dutiful workflow for freight forwarders when they need clearer coordination across shipment information and operating handoffs. The tool doesn't replace carrier due diligence. It can support the information discipline that makes due diligence meaningful.
A partner should make the plan easier to execute, not merely cheaper to purchase.
Actionable Steps to Improve Your Distribution Planning Today
Improvement starts with a short operating reset, not a large software project. Gather the people who own demand, inventory, warehouse flow, transportation, customer commitments, and finance. Put one recent service failure on the table and trace the decision path from the first bad assumption to the final recovery move.
Establish the rules before tuning the model
Write down which data sources are authoritative, who may change a forecast, what counts as a confirmed order, and which exceptions require executive approval. If sales can add volume without a capacity review, the plan will remain unstable no matter how capable the forecast engine becomes.
Set a fixed S&OP rhythm, then connect it to a shorter execution forum. The first meeting resolves resource and demand trade-offs. The second checks what changed, assigns actions, and protects the next operating window. Keep the conversations separate enough to move quickly, but use the same definitions and assumptions.
Clean the inputs that move freight
Prioritize the data fields that affect physical execution:
- Customer and location data: Verify ship-to addresses, receiving windows, node assignments, and service requirements.
- Item data: Correct case dimensions, handling rules, pack quantities, and unit conversions.
- Calendar data: Maintain holidays, facility closures, promotions, blackout dates, and planned maintenance.
- Transportation data: Review lane schedules, equipment limits, driver-hour assumptions, and expected transit behavior.
- Exception data: Classify late departures, missed appointments, short shipments, and cancellations consistently.
Don't ask the planning team to compensate for defects that belong to the source function. Give each data owner a correction deadline and make unresolved defects visible in the operating review.
Build a response-ready plan
Rank risks by operational fragility and cost-to-serve impact, not by the loudest headline. ASCM's 2025 supply chain trends report emphasizes diversification and contingency planning in response to trade dynamics and geopolitics. For a distribution leader, that principle becomes practical when the team identifies which lanes, facilities, products, and customers have the fewest recovery options.
Run focused scenarios rather than endless simulations. Test a missed inbound, a constrained dock, a sudden demand change, a carrier call-off, and a facility outage. For each scenario, document the trigger, decision owner, alternate node, transportation option, customer communication, and return-to-normal condition.
Finally, review execution every week. Remove obsolete overrides, close data defects, and compare planned versus actual departures, arrivals, inventory positions, and recovery actions. A realistic plan isn't one that predicts every disruption. It's one that gives people a clear response when the prediction fails.
Peak Transport provides structured overnight box-truck middle-mile service connecting distribution centers and regional hubs across the Twin Cities area, supported by route planning, dispatch communication, W-2 drivers, and safety-focused operating standards. Visit Peak Transport to discuss dependable middle-mile execution for your network or explore career opportunities in Minnesota.