Transportation Cost Management: Drivers, Levers and KPIs
Learn transportation cost management with the cost drivers, levers, KPIs and checklist middle-mile carriers use to cut spend per completed move.
November 5, 2026
You're staring at last month's freight invoice, and the fuel line looks almost reasonable. The total still jumped. The extra money isn't in the diesel price. It's in the empty run back to the hub, the driver waiting at a dock, and the truck that left half full on a lane you run every night.
That gap is what transportation cost management is built to close. Treat each recurring lane as its own budget. Measure cost per completed move and cost per on-time move, not cost per mile. Fuel is one line. Non-fuel cost, empty miles, and delay time usually move the bill more.
The model below works like a household budget you can run on your own lanes, with plain arithmetic and no mystery rate.
What Transportation Cost Management Covers
Think of a household budget. Rent, groceries, and the electric bill are separate lines, not one lump sum you glance at and shrug off. Transportation cost management works the same way for trucks. Every mile, every paid hour, and every idle minute is its own line item.
It is the ongoing practice of planning, measuring, and controlling what it costs to move freight. Route design, driver hours, vehicle utilization, and on-time delivery all sit inside that practice. A yearly rate sheet is not the same thing.
The scale is why this belongs with finance, not only with dispatch. The Council of Supply Chain Management Professionals' State of Logistics measurement put total U.S. business logistics costs at approximately $2.3 trillion in 2022, equal to 9.1% of U.S. nominal GDP. Transportation was the largest piece, at $1.3914 trillion. Road freight reached $896 billion, up 6.1%. Road transportation alone accounted for roughly 64% of total transportation spending that year.
A fixed annual budget falls behind when rates, fuel, and capacity move in cycles. You remeasure the same lanes, because a static number can't keep pace.
Three priorities follow from that scale:
- Mileage: fewer miles for the same freight.
- Utilization: more freight in each paid hour and each truck.
- Schedule reliability: arrivals that hold, so overtime and failed deliveries don't rewrite the bill.
Small gains on those three add up across lanes you run every week. Components, levers, and the numbers that prove them come next, in that order.
The Cost Components Behind Every Mile
Fuel alone understates the full bill. A fully loaded cost counts every dollar the lane consumes, then spreads it across miles and hours. The Federal Highway Administration framework names six core components: driver, vehicle, fuel, tires, repairs, and overhead. For a box-truck network, add a seventh line, deadhead miles, because empty repositioning is an actual expense even when the customer never sees it.
| Cost component | What drives it | Warning sign |
|---|---|---|
| Driver | Paid wages, benefits, and overtime | Paid hours rising faster than productive hours |
| Vehicle | Depreciation, insurance, and utilization | Low cube fill or idle equipment on recurring lanes |
| Fuel | Miles, idling, speed, and stop-start driving | Fuel per loaded mile climbing with flat volume |
| Tires | Mileage, load, and road conditions | Tire replacements arriving ahead of the mileage plan |
| Repairs | Vehicle age and preventive maintenance gaps | Breakdowns and unplanned repair spend rising |
| Overhead | Dispatch, office, facilities, and software | Overhead growing faster than completed moves |
| Deadhead miles | Empty repositioning between stops | Empty-mile share climbing on the same lanes |
Two ways a "cheap" route gets expensive
A route can look profitable on loaded miles and still lose money once empty travel is allocated to the shipment. Say the loaded leg is 80 miles and the bobtail back is 40. Quote only the 80, and you hide a third of the distance inside someone else's lane.
Extended dwell raises driver and equipment cost even when miles stay flat. The truck isn't burning much fuel at the dock. The driver is still on the clock, and the tractor isn't starting the next move. Low cube utilization does the same thing to cost per shipment. The route length is unchanged, and each carton carries a bigger share of the truck.
The same FHWA framework names fleet-management skill, driver wages, fuel prices, and truck technology as factors that change transportation cost. Dispatch quality and operating discipline are controllable levers, not office overhead you have to tolerate.
Tire and repair lines move with how the truck is kept, not only with how far it runs. A written fleet maintenance planning for managers habit, paired with a clear view of box truck maintenance costs, keeps those two lines from showing up as surprise invoices.
Score the lanes: On your three busiest lanes, mark the component with the worst warning sign. Fix that one before you chase a cheaper fuel card.
Build each lane from vehicle miles, paid driver hours, loaded miles, and shipment volume. Then watch cost per route, cost per loaded mile, cost per productive hour, and cost per ton or per cubic foot. A mileage spike points to routing. A dwell spike with flat miles points to the facility.
Operational Levers That Cut Cost Fastest
Cut cost in a set order. Route planning sits at the base. Mode, schedule, and utilization only pay off after the path itself is sane.
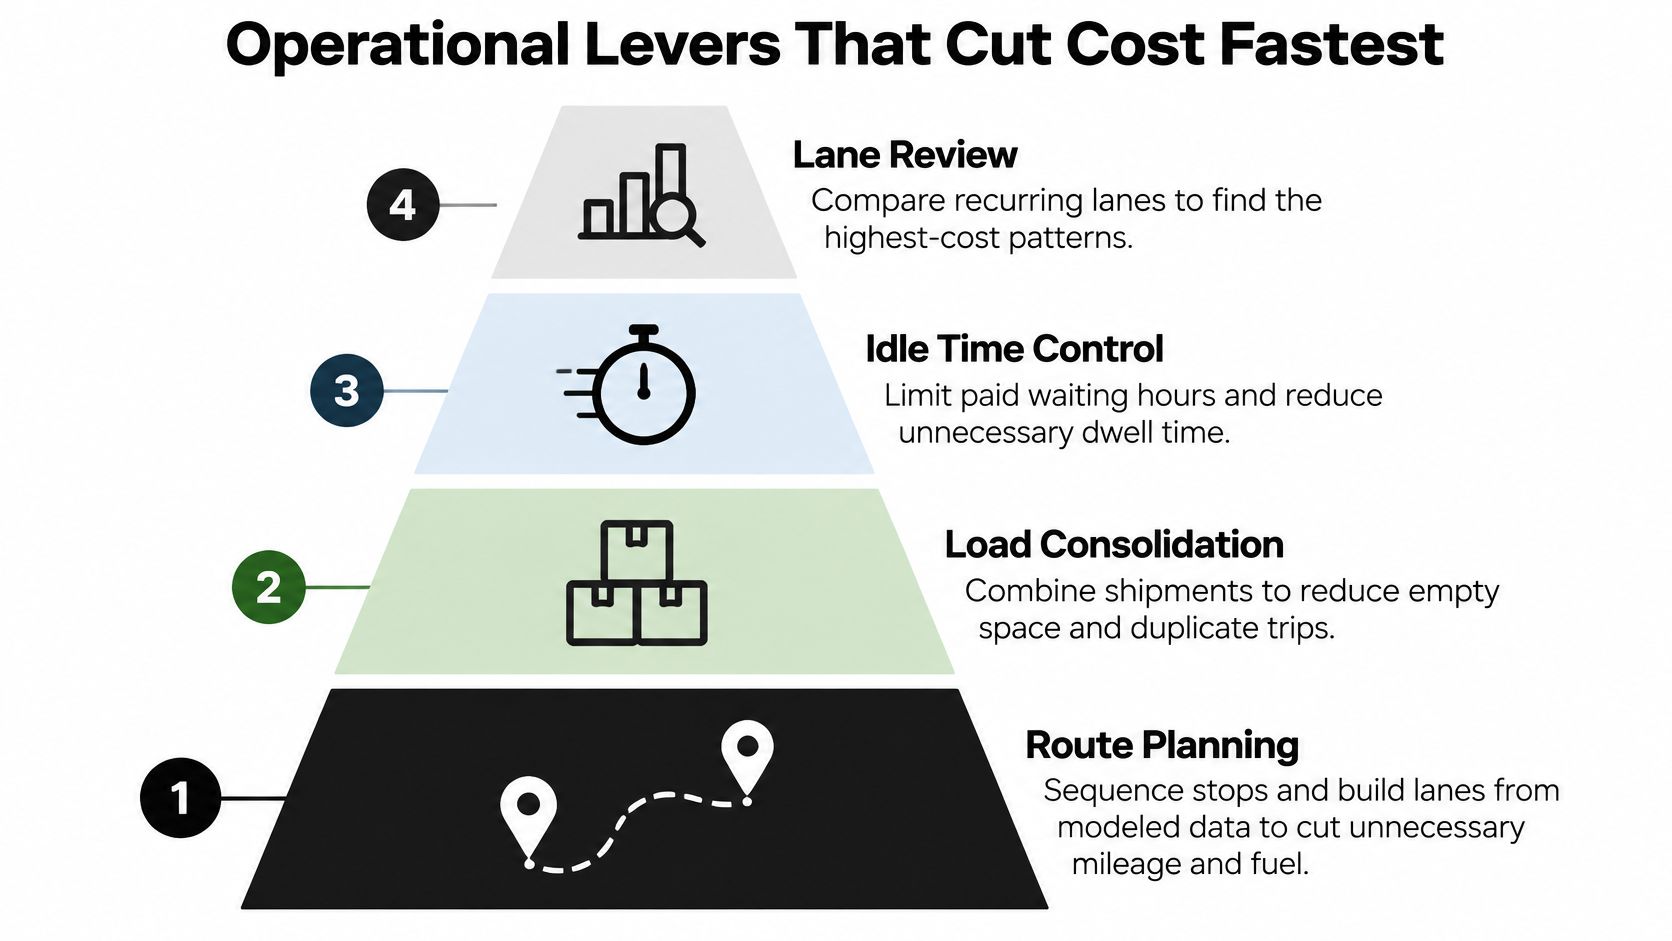
Route planning comes first. Sequence stops and build lanes from modeled data so you drop miles you don't need. Our route optimization uses data modeling to reduce mileage and cut fuel consumption. Driver routes are scheduled runs between facilities, planned in advance, not improvised residential stops.
Mode selection is the match between vehicle and freight. A box truck that is too large for the cube burns wages and fuel on air. One that is too small forces a second trip. Steady volume belongs on a fixed lane, where the schedule repeats, not on a fresh dispatch every night.
Scheduling follows time reliability, not the shortest line on a map. A route that is 10 miles shorter and routinely stuck in congestion can cost more than a longer route with a stable travel time. Set departure windows and hub arrival order based on how the lane behaves.
Utilization is the last step up. Raise cube fill and cut dwell so each paid hour carries more freight. A fuller truck on a reliable window beats a fast empty one.
The FMCSA's 2020 regulatory analysis estimated marginal operating costs at $71.78 per hour in 2018, covering vehicle costs such as fuel and insurance plus driver wages and benefits. At that rate, an avoidable two-hour delay is about $143.56 before missed appointments, overtime, or a failed delivery. Consistent speed, and staying out of stop-start traffic, moves the same freight in fewer work hours.
Measure facility dwell, gate-to-gate time, average speed, stop count, and on-time performance apart from route miles. Convert extra minutes into dollars with your own fully loaded hourly rate. Then look for the repeat cause: appointment windows, freight that isn't ready, paperwork errors, or a slow yard.
This short walk-through shows how planners turn those same levers into a daily dispatch habit.
| Lever | Number that proves it is working |
|---|---|
| Route planning | Empty mile share |
| Mode selection | Cube utilization |
| Scheduling | On-time performance |
| Utilization | Cost per productive hour |
If empty mile share falls and on-time performance doesn't, you shortened the path and broke the window. Keep the lever that the number supports.
Compliance and Labor Policies That Protect Margins
A common assumption treats compliance and labor as overhead you absorb. They are cost levers with a direct line to margin. In a 2024 logistics and transportation trends survey published by Supply Chain Management Review, 64% of respondents said regulations raised operational costs by 1% to 10%, and 21% said the increase was 10% or more.
Where the cost actually lands
On a box-truck operation, compliance shows up in four places you can count:
- Pre- and post-trip inspections: minutes on the clock before the first mile and after the last stop.
- Regular vehicle inspection: downtime and shop cost that prevent a breakdown mid-lane.
- Proof-of-delivery paperwork: the record that lets you bill and that ends a detention argument.
- Driver-hour recordkeeping: the log that keeps a "cheap" extra stop from becoming an hours violation.
Weak documentation turns into rework. A missing signature becomes a detention dispute. A sloppy POD becomes a billing delay, and the cash sits in someone else's inbox while your wages are already paid.
Labor cost hides in turnover. Every new driver needs paid time on routes, safety standards, and equipment such as pallet jacks. We provide that paid training on safety standards, routes, equipment, and company procedures. Skip a step, and it shows up later as slower loading or a safety incident. Our drivers are W-2 employees, not 1099 contractors, which gives us direct control over scheduling, training, and safety standards and cuts the variability that contract labor often leaves on the lane.
Teams that don't keep a safety lead on staff can use outsourced health and safety support so inspections and training don't depend on whoever is free that week. Pair that with a standing check on wage and hour compliance so paid time and recorded time stay the same number.
Walk one week of trips and mark every inspection, training hour, POD correction, and disputed detention. The fattest mark is the compliance cost hiding on that lane.
KPIs for a Transportation Cost Dashboard
Capacity, utilization, and market price move before the invoice does. A dashboard that only shows last month's total is already late. You want leading signals beside the spend.
Fuel-only programs miss the structural rise. Transport Topics, reporting recent U.S. trucking operating-cost data, noted that excluding fuel, costs increased 4.2% in 2025, faster than the 3.4% total increase. Repair and maintenance rose 8.6%, tolls rose 13.2%, and driver wages plus benefits exceeded $1.00 per mile for the first time, at $1.028 per mile. Fuel optimization alone may save little when non-fuel lines drive the growth.
Six numbers, and how often to look
| KPI | How to calculate it | Review cadence |
|---|---|---|
| Cost per loaded mile | Total lane cost divided by loaded miles | Weekly |
| Cost per completed move | Total lane cost divided by completed moves | Weekly |
| Cost per productive hour | Total paid driver and equipment cost divided by productive hours | Weekly |
| Empty mile share | Deadhead miles divided by total miles | Weekly |
| On-time performance | On-time moves divided by total moves | Daily |
| Cube utilization | Cubic feet loaded divided by cubic capacity | Per route, weekly |
Cost per completed move and cost per on-time move matter more than cost per mile on a middle-mile network. A low mile rate that leaves freight behind, or delivers it late, hasn't finished the job the customer paid for. Include paid non-driving time, detention, empty repositioning, overtime, benefits, preventive maintenance, breakdown risk, and the cost of a late or failed delivery.
Test the linehaul question on the lane, not in the abstract. A slightly higher linehaul price can lower total lane cost once asset utilization, schedule consistency, driver-hour compliance, and on-time performance are in the model. Compare a fixed overnight route with ad hoc dispatch of the same freight. Keep the pattern with the lower cost per on-time move.
A practical set of transportation key performance indicators only works if someone acts on them.
When any KPI sits outside its baseline for two reviews in a row, pull that lane's reason codes and name one owner to fix the cause.
A Middle-Mile Lane Example from Start to Finish
Say a regional operator runs an overnight box-truck lane from a distribution center to a Twin Cities hub. The freight is middle mile, between warehouses, hubs, and distribution centers. The work is local, so the driver is home after the shift, with no long-haul overnight trip. Every figure below is illustrative, so you can see the arithmetic. Swap in your own.
- Record 30 days. Loaded miles 4,200. Deadhead miles 800. Paid driver hours 180. Completed moves 60. On-time moves 51.
- Total the fully loaded cost. Using the component list and this fleet's own hourly rate, the lane costs $18,000 for the month. Fuel is inside that total, not the total.
- Divide twice. Cost per completed move is $18,000 / 60, or $300. Cost per on-time move is $18,000 / 51, or about $353. The gap between those two is the price of the nine late or missed windows.
- Compare dispatch patterns. Ad hoc dispatch of the same freight shows 3,900 loaded miles, which looks cheaper on a map. Dwell and missed windows push paid hours to 210 and on-time moves to 42. Illustrative lane cost rises to $19,500. Cost per completed move is $325. Cost per on-time move is about $464.
- Decide. Keep the fixed overnight schedule. The first lever to fix is dwell at the hub, because paid hours, not miles, blew up the ad hoc version.
Run the same five steps every month. The lane stops being a recurring surprise and becomes an asset you can manage, reprice, or redesign.
Tools and Processes to Adopt First
Software is the wrong first purchase for many regional fleets. Recent survey evidence cited by Boston Consulting Group shows larger shipping spenders are more than twice as likely as small and midsize companies to adopt a transportation-management system. In the same findings, 68% of shippers planned to renegotiate freight contracts, and 54% intended to cut cost through warehouse optimization. In 2025, 61% of surveyed transportation professionals ranked cost reduction as a top priority, rising to 76% among shippers.
Process return versus software return
For box-truck and overnight networks, dispatch discipline often pays back before a full system does. Standardize these four records first:
- Route sheets with the same fields on every trip.
- Proof of delivery that matches the move you intend to bill.
- Planned-versus-actual mileage on every route, including empty miles.
- Reason-coded delays, so "late" has a cause, not a shrug.
Automation applied to messy timestamps, empty-mile gaps, or guessed stop times scales the bad assumption. Resilience and compliance value count alongside the immediate saving. A system that can't show driver hours or exception codes hasn't earned its fee.
Buy a full TMS after you have two to three months of clean data on every lane, and only if the volume justifies the spend. Until then, telematics for mileage and idle time, plus a shared lane-cost workbook, will carry the review. The workbook should hold the six KPIs, the component totals, and the owner of each exception.
Start Your Cost Review This Quarter
You can build a usable baseline inside one quarter. Do the steps in this order, and don't skip ahead to software.
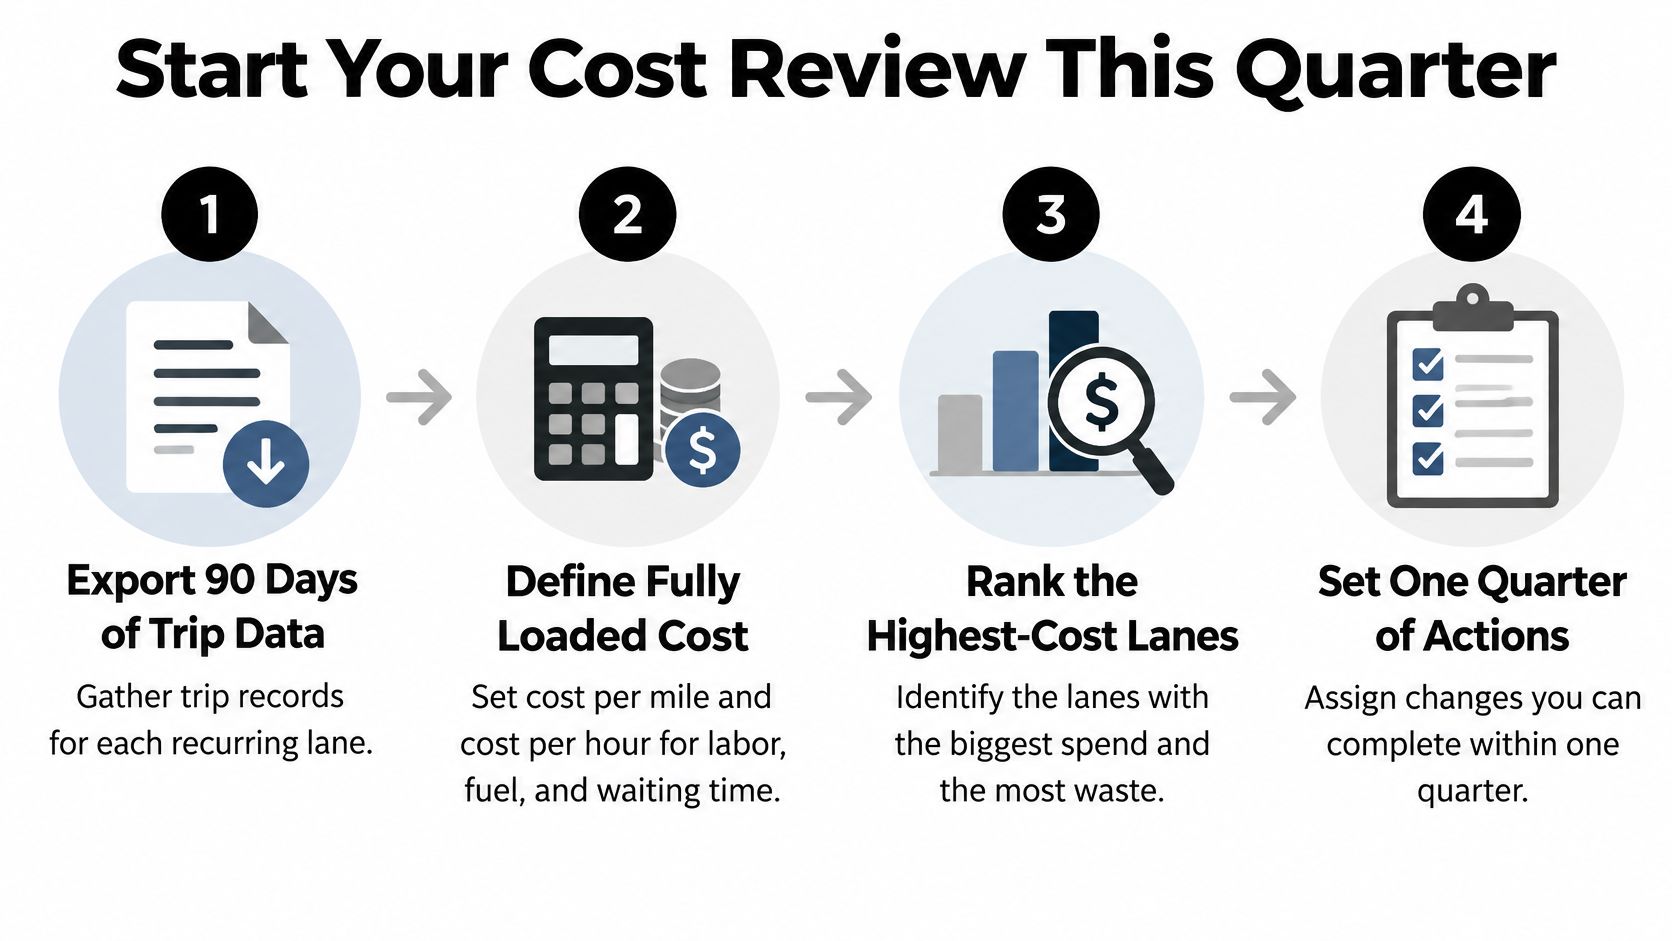
- Export 90 days of trip data for each recurring lane.
- Define fully loaded cost per mile and per hour on every lane.
- Add deadhead miles and paid non-driving time to the model.
- Standardize route sheets, proof-of-delivery entries, and delay reason codes.
- Choose five or six KPIs from the dashboard table and set a weekly review.
- Set exception thresholds and assign one owner for each lane.
- Run one fixed-schedule pilot on the most volatile lane.
- After 90 days of clean data, reassess whether a full TMS is justified.
These eight steps are the baseline any middle-mile partner needs before a lane quote means anything. Without them, a rate is a guess dressed up as a contract.
For route planning and overnight middle-mile lanes in the Twin Cities, call Peak Transport at 612-230-1292 and bring your current lane data. We'll walk the fully loaded cost with you and show where empty miles and delay time are sitting.
Peak Transport runs overnight box-truck middle mile between distribution centers and hubs, with routes planned in advance and cost watched at the lane, not just at the fuel pump. If you want that model on your Twin Cities freight, visit Peak Transport and send your recurring lanes for a cost review.