Customer Satisfaction Metrics for Middle-Mile Logistics
Learn the key customer satisfaction metrics for middle-mile logistics: NPS, CSAT, CES, on-time rate, damage rate, and how to calculate and benchmark each.
November 7, 2026

You're looking at a quarterly review where a shipper contact just told you the relationship score dropped, but your overnight lanes still look on time. That gap is familiar in middle-mile work. A single number can tell you confidence fell without telling you if the cause was an ETA revision, a paperwork correction, or damaged freight. Customer satisfaction metrics work when you link each score to the shipment-level cause behind it, so you fix the process that produced the low number.
Customer Satisfaction Metrics at a Glance
| Metric | What It Measures | Formula or Scale | Review Cadence |
|---|---|---|---|
| NPS | Likelihood a shipper contact recommends Peak | % promoters (9-10) minus % detractors (0-6), range -100 to +100 | Quarterly |
| CSAT | Satisfaction with one shipment or interaction | % choosing the top two points on a five-point scale | Weekly, after each qualifying event |
| CES | Effort needed to resolve a shipment issue | Average of a 1-7 agreement rating (higher = easier) | Weekly, per exception type |
| On-time delivery rate | Deliveries completed inside the agreed window | On-time shipments / total shipments x 100 | Daily, by lane |
| Damage rate | Shipments arriving damaged | Damaged shipments / total shipments x 100 | Weekly, by driver and route |
| Delivery accuracy rate | Shipments with correct count, documents and proof of delivery | Error-free shipments / total shipments x 100 | Daily |
| Complaint rate | Customer complaints relative to volume | Complaints / total shipments x 100 | Weekly |
What Each Score Misses Alone
NPS shows whether a contact would vouch for you, but it doesn't name the failure that hurt confidence. CSAT captures how one shipment felt, but it can't tell you whether trust is building across a quarter.
CES reveals friction in getting help, yet it won't show whether freight arrived intact. On-time delivery rate proves you hit the window, not that the count or paperwork was right.
Damage rate tracks condition, not communication. Delivery accuracy rate tracks correctness, not how hard the shipper worked to fix an error, and complaint rate only counts people who bothered to complain.
If you're building a wider feedback program around these numbers, Yellow.ai's framework for enterprise customer feedback is a useful companion for structuring how you collect and route responses. Keep the seven metrics together, though. No single score explains both how a customer felt and what operation produced that feeling.
Three Lenses Behind Every Score
A fleet manager doesn't read one gauge to decide a truck is safe to run. Read customer satisfaction metrics the same way, through three lenses that answer different questions.
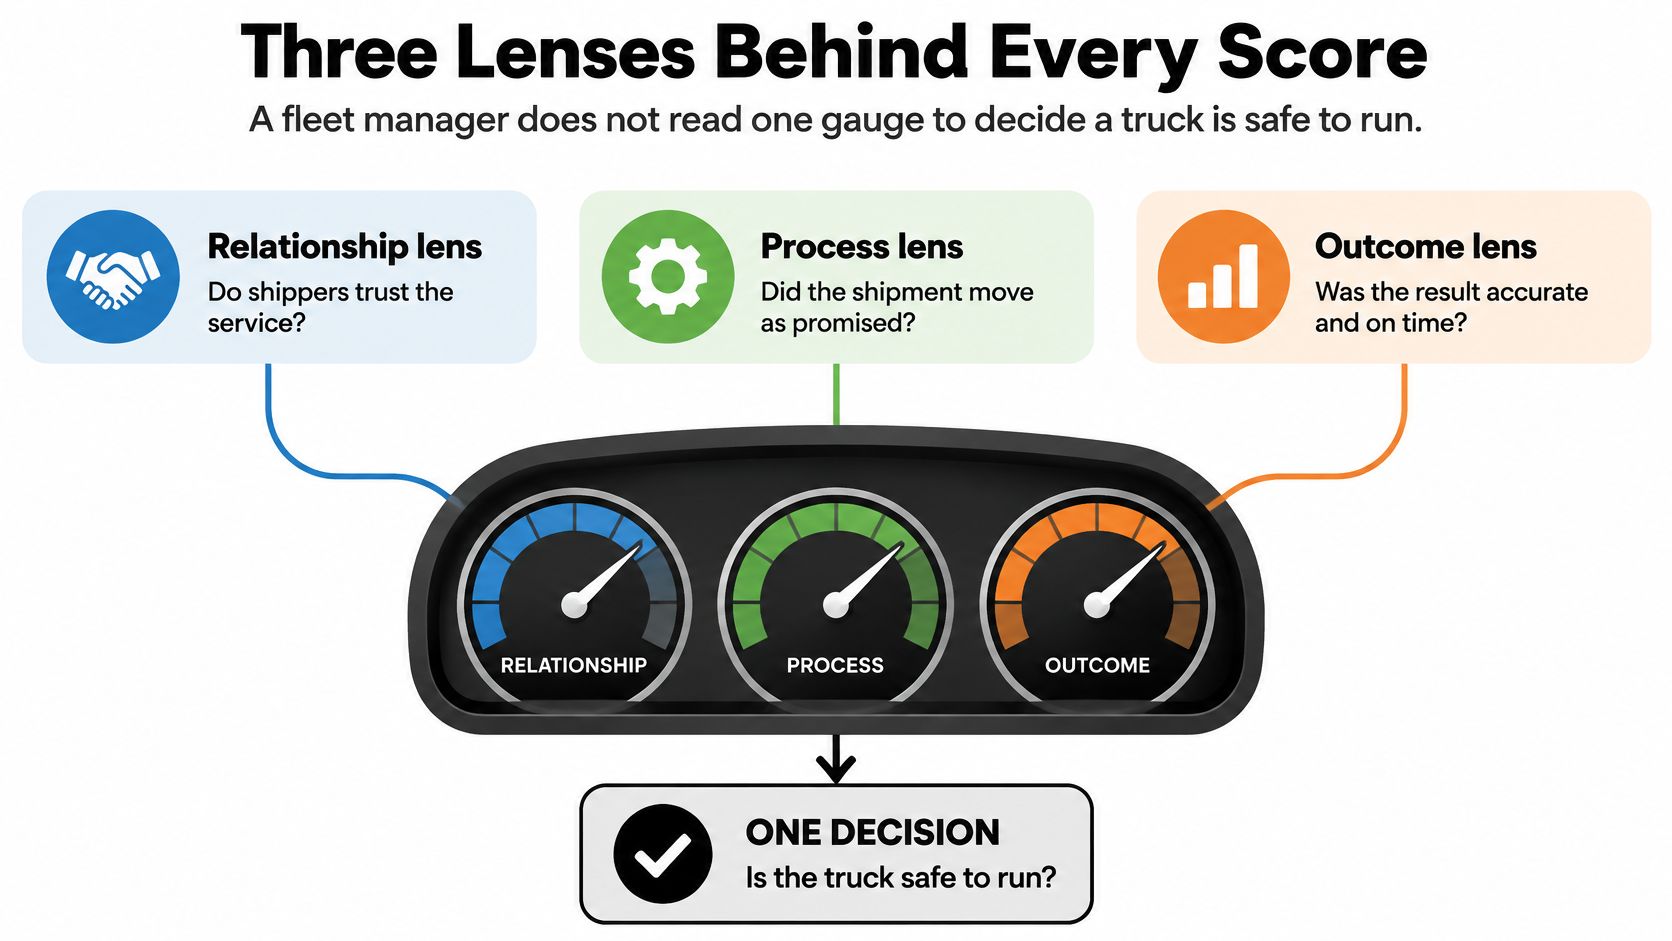
Relationship Lens
Do shippers trust the service enough to recommend it? That's the job of Net Promoter Score. The IBM overview of Net Promoter Score notes it became a foundational customer-experience metric in the early 2000s after development by Fred Reichheld, Bain & Company, and Satmetrix. Respondents scoring 9 or 10 are classified as promoters, those scoring 7 or 8 as passives, and those scoring 0 through 6 as detractors, producing a range from -100 to +100.
Use NPS after completed lanes, delivery exceptions, or recurring account reviews. Say a planner gives you a 9 after a month of clean overnight loads. Next quarter you get damaged freight and missing paperwork, and the score drops, but the number alone can't reveal which failure caused it.
Working rule: Relationship scores show where you stand, transaction scores show how one event felt, and operational rates show why.
Transaction Lens
CSAT and CES sit here, measured right after a specific event such as an ETA change, a delivery, or an exception close. They're close to the moment, so memory is fresh and you can tie the answer to one shipment.
That closeness is also their limit. A frustrated response after one hard night doesn't mean the whole account is at risk, and a happy response after an easy load doesn't prove the lane is healthy.
Operational Lens
On-time, damage, accuracy, and complaint rates come from shipment records, not opinions. They show what happened across every load, including loads nobody surveyed.
Never read NPS alone, because a high recommendation score doesn't show whether the underlying problem was late arrival, inaccurate documentation, poor dispatch communication, or damaged freight. Pair it with the operational lens and the score becomes a starting point for a specific fix, not a verdict you argue about.
Calculating On-Time, Damage and Accuracy Rates
Clear definitions come before arithmetic. If two dispatchers use different arrival windows, you'll get two different rates for the same lane.
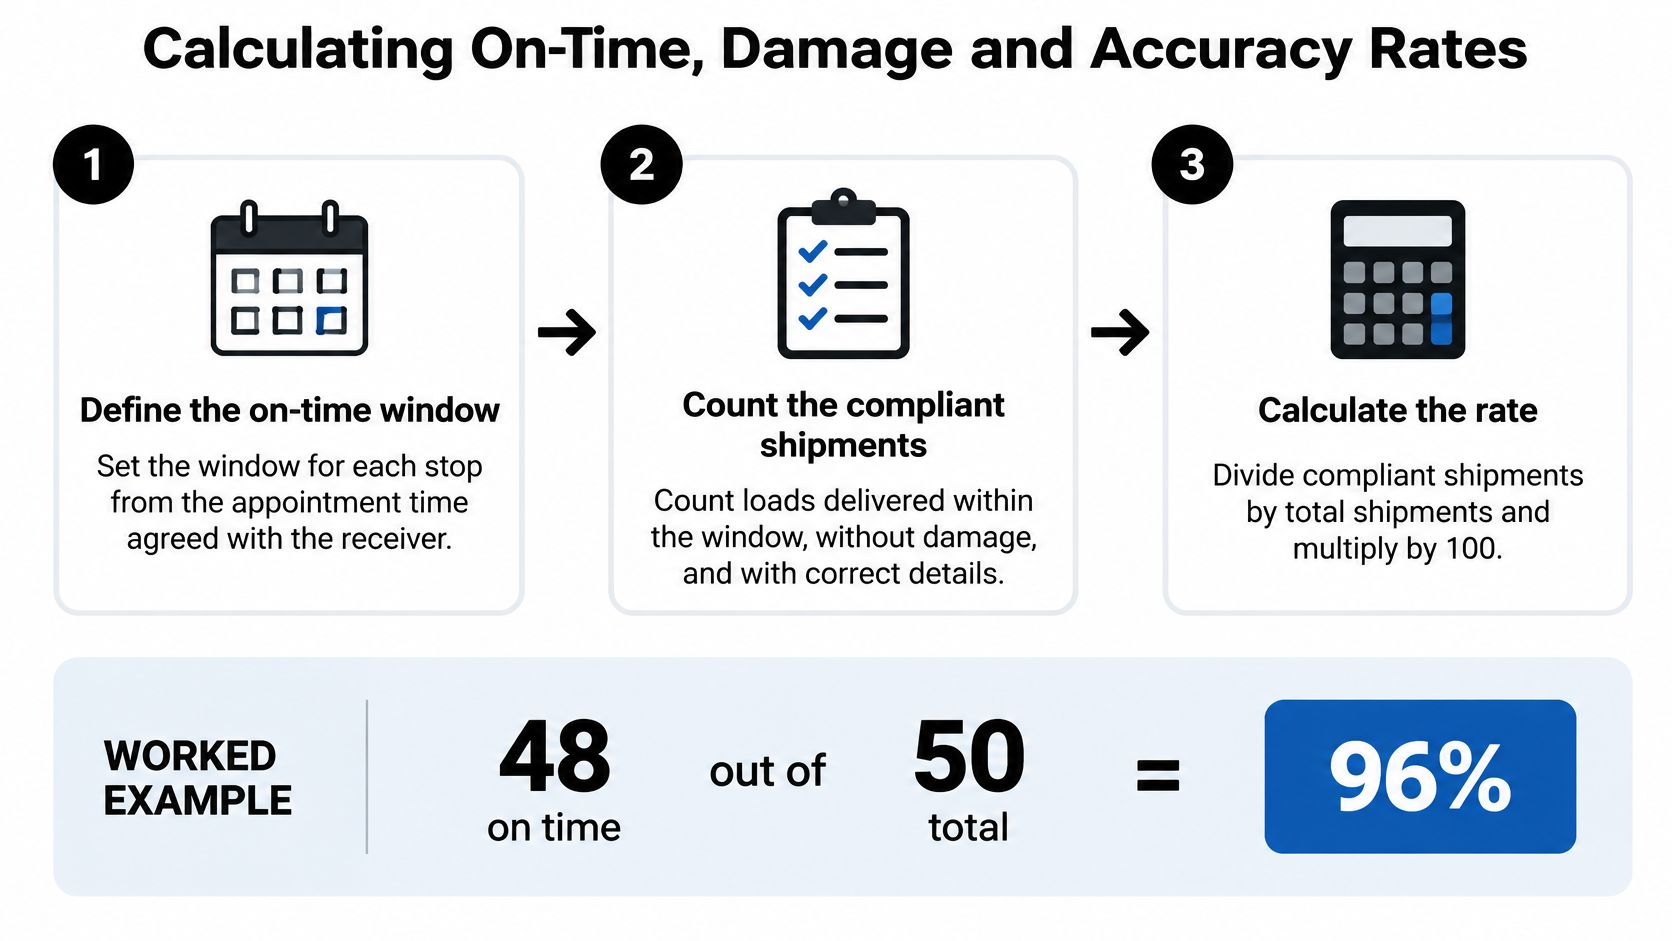
Six Steps That Keep Rates Comparable
- Define the on-time window for each stop: Use the appointment time agreed with the receiver for that facility. A rate is only as good as its window, so write the window into the lane record.
- Pull records for the same period: Use the transportation management system, dispatch log, and proof-of-delivery files together. Matching periods prevents a delivery counted in one system from disappearing in another.
- Count total and compliant shipments: Count loads that arrived on time, had the correct count and documents, and had no damage. Separate counts matter because one load can pass one test and fail another.
- Divide and multiply by 100: Divide each compliant count by total shipments and multiply by 100. That gives you comparable percentages for on-time, accuracy, and damage performance.
- Segment the result: Split each rate by lane, driver, shift, and dispatch team. A company average can hide one route that's failing every night.
- Add event data: Record ETA revisions, paperwork corrections, and claim count beside each rate. Those details point to the process behind a dip, especially when you're reviewing practical steps for preventing cargo damage after a route starts producing claims.
Where the Numbers Come From
| Data Source | Metrics It Feeds | Owner | Refresh |
|---|---|---|---|
| Dispatch and ETA log | On-time delivery rate, ETA revisions | Dispatch lead | Real time |
| Proof-of-delivery records | Delivery accuracy rate, paperwork corrections | Compliance coordinator | Daily |
| Claims and damage log | Damage rate, claims frequency | Safety lead | Weekly |
| Complaint and exception tickets | Complaint rate, time to close, CES inputs | Customer service lead | Daily |
| Event-triggered survey | CSAT, CES | Account manager | After each qualifying event |
| Quarterly relationship survey | NPS | Operations director | Quarterly |
Worked Example
Say an illustrative week has 1,900 shipments. If 1,812 arrive on time, that's 95.4% on-time, and 1,871 error-free shipments give 98.5% accuracy. Six damaged shipments produce a 0.3% damage rate, while 14 complaints produce a 0.7% complaint rate.
Now pair those facts with survey answers. The ACSI guide to measuring customer satisfaction models satisfaction as a function of customer expectations, perceived quality, and perceived value. If CSAT falls primarily after documentation corrections rather than late arrivals, improving dispatch-document accuracy may create more value than chasing marginal route-speed gains.
Keep the same denominator every week. Changing what counts as a shipment makes a trend look better or worse without any real change on the road.
Measuring Effort and Shipment Satisfaction
Effort is where middle-mile service often succeeds or fails. A load can arrive inside the window while the shipper still had to call three times for an ETA.

Customer Effort Score
Use one consistent statement, "Peak made it easy to manage this shipment," on a 1-7 agreement scale. Send it immediately after high-friction events such as an ETA change, a shortage, a damage exception, or a documentation correction, not only after successful deliveries.
The Henley Business School summary of customer effort research reports research covering more than 75,000 B2B and B2C customer interactions found that Customer Effort Score outperformed both traditional satisfaction measures and Net Promoter Score in predicting repurchase and increased spending. That's why CES works best as a diagnostic leading indicator, not a standalone loyalty score.
Segment CES by lane, facility, shift, account, exception type, and dispatch team. Then link it to data you control, including number of customer contacts, time to first response, handoffs, ETA revisions, paperwork corrections, and time to close an exception.
Watch for the clearest warning pattern. If contact count and resolution time rise while CES falls, you've got process friction, even when on-time delivery remains acceptable. That pattern also connects directly to habits that help logistics teams build customer trust, because customers notice whether getting help feels straightforward.
CSAT for One Shipment
Ask CSAT after delivery on a five-point scale and report the percentage choosing the top two responses. Keep that transactional question separate from your relationship survey, since one shipment and accumulated confidence aren't the same thing.
The short video below walks through how timing and wording shape what a post-event score can and can't prove.
There's no universal CES benchmark you can import. Trend performance against your own baseline and compare equivalent shipment types, because customer mix, facility complexity, and survey timing can otherwise create misleading comparisons.
Collecting Feedback Without Survey Fatigue
More invitations don't automatically produce better evidence. The 2025 ACA State of CX report found that 24% of customers stopped doing business with a company because its satisfaction survey was too long, 26% because the company sent too many surveys, and 38% because it failed to respond to critical feedback submitted through a survey.
That last number should shape your design. Collecting criticism and then going quiet can damage trust more than not asking in the first place.
Fewer Questions, Better Timing
Keep event surveys to one to three questions. Trigger them after moments that matter, such as a missed appointment, a recovered exception, or successful peak-period execution, and cap invitations per contact each month.
Different roles live through different moments of truth. A shipper, a distribution-center contact, a transportation planner, and a receiving team may judge the same lane by entirely different events, so don't collapse them into one company-wide average.
- Segment by role: Report results separately for shippers, planners, distribution-center contacts, and receiving teams.
- Segment by operation: Split by lane, shift, service event, and shipment volume before you draw conclusions.
- Track silence: Record nonresponse by role, because silence from a time-poor planner isn't satisfaction.
Close Every Loop
Give every negative response an owner and a response-time target. Then report back to the customer with what changed, even if the change is small.
A larger sample can still mislead you if dissatisfied or time-poor customers systematically opt out.
For overnight middle-mile operations, reliability and communication may matter more than a generic relationship score. A short question after a recovered exception, answered by the right person and followed up visibly, teaches you more than a long quarterly survey that busy contacts ignore.
Setting Benchmarks and SLAs for Box-Truck Lanes
Borrow the diagnostic structure of a national index, not its number. The American Customer Satisfaction Index history explains that ACSI was launched in the United States in 1994 and uses an econometric model combining customer expectations, perceived quality, and perceived value to estimate satisfaction. It also connects satisfaction with outcomes such as complaints and loyalty.
That structure helps you separate three different problems. Dissatisfaction may come from poor execution, unmet delivery expectations, or weak perceived value, and each one needs a different response.
Set each SLA from a 90-day baseline per lane instead of a generic industry figure. A tight urban overnight lane and a longer regional lane shouldn't inherit the same starting target, and documenting service level agreements clearly helps both sides use the same definitions.
| Metric | How to Set the SLA | Review Trigger | Owner |
|---|---|---|---|
| On-time delivery rate | 90-day baseline per lane and shift | Two consecutive weeks below baseline on any lane | Dispatch lead |
| Damage rate | Claims history per route and per driver | Any route or driver above its claims history for two weeks | Safety lead |
| Delivery accuracy rate | 90-day proof-of-delivery audit baseline per lane | Two audits in a row below baseline | Compliance coordinator |
| Complaint rate | Prior three-month average for equivalent shipment volume | Monthly rise above the prior three-month average | Customer service lead |
| CSAT | Trend against Peak's own post-event baseline | Sustained decline across two survey cycles | Account manager |
| CES | Trend against own baseline, compared within like shipment types | Rising contact count with falling CES for two weeks | Operations director |
| NPS | Quarterly trend against Peak's own history | Decline across two consecutive quarters | Operations director |
How to Read a Trigger
An on-time trigger sends the dispatch lead to lane timing, dwell, and ETA practice first. A damage trigger sends the safety lead to loading, securement, and handling on that route, not to a general reminder for every driver.
For NPS, CSAT, and CES, there's no universal benchmark that settles the target for you. Use trend against your own history, compare like shipment types, and change one SLA at a time so you can see which change moved which number.
Start One Metric Baseline This Month
Start with one operational metric that has a clear owner. On-time delivery rate or damage rate usually works best, because dispatch or safety can act on the result without waiting for a survey cycle.
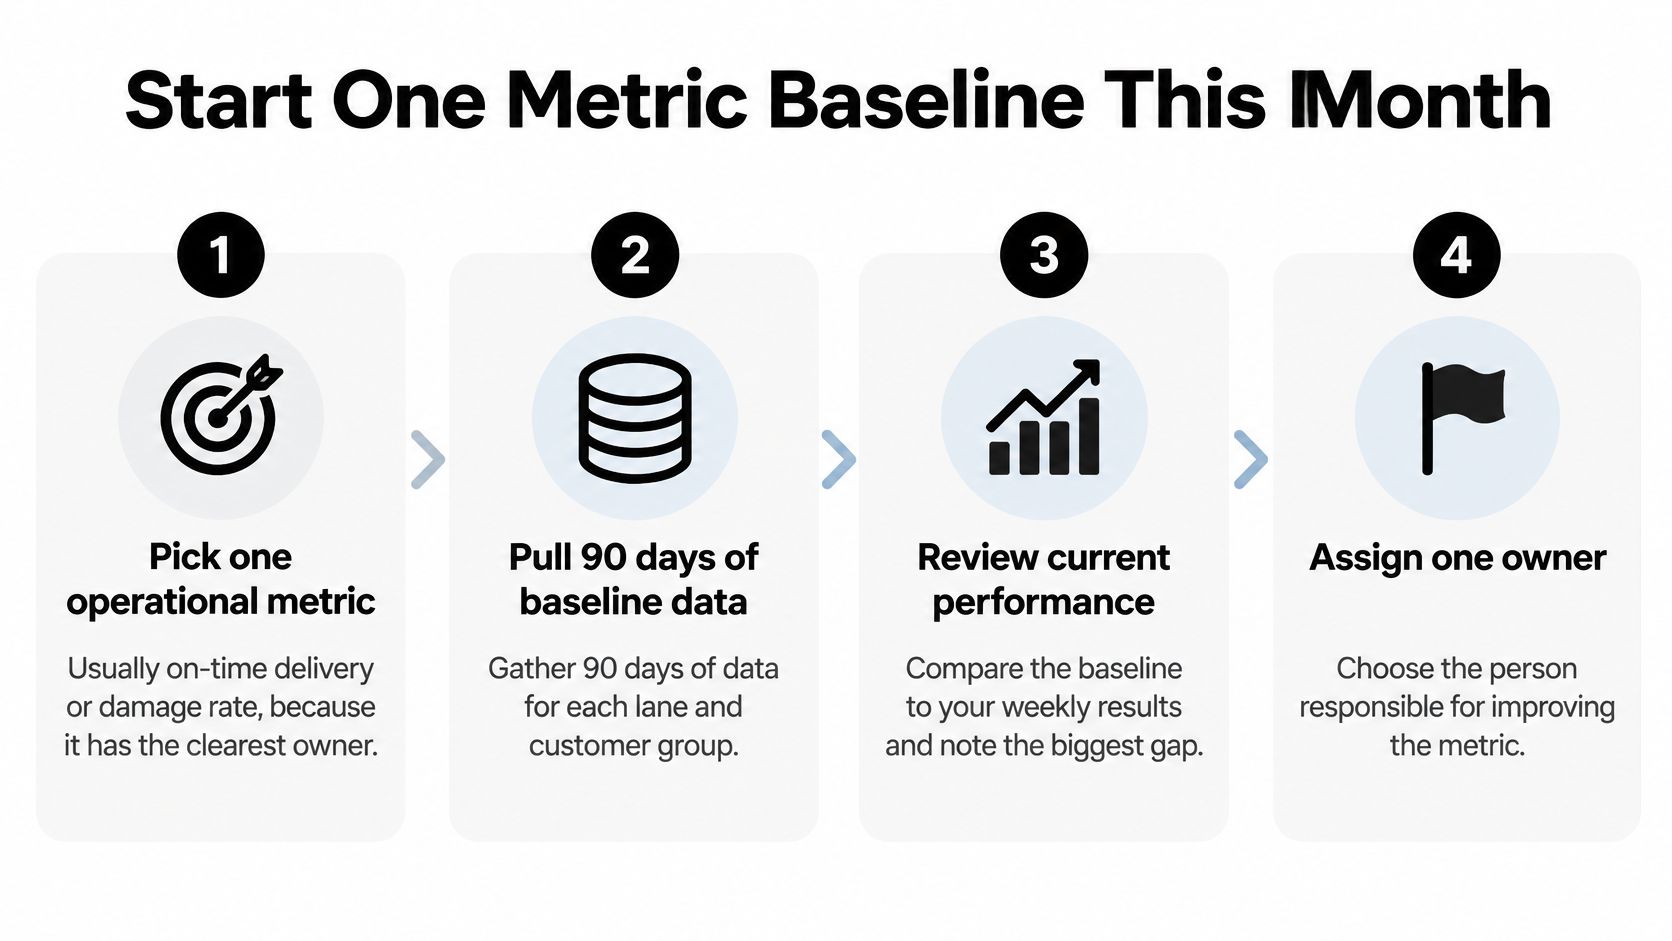
A Five-Step Baseline Plan
- Pick one operational metric: Choose on-time delivery or damage rate for a defined set of lanes. One metric keeps the first review focused and makes ownership unmistakable.
- Pull 90 days of baseline data: Gather results for each lane and shift using the same definitions every week. Without that history, you can't tell a real improvement from a quiet week.
- Assign one owner and a review date: Name the person responsible and set a review 30 days out. The owner brings the segment breakdown, not just the headline rate.
- Test one process change at a time: Try a dispatch routine for ETA updates, a pre-trip paperwork check, or a refresher on safe load handling. Changing three things at once leaves you guessing which one worked.
- Compare with matched lanes: Compare the changed lane with similar lanes or accounts over the same period. That comparison helps you separate a process effect from seasonal volume or an easier freight mix.
Connect the Fix to the Operation
Route planning protects the metric before a truck leaves. Our Route Optimization uses data modeling to reduce mileage and cut fuel consumption, and reducing unnecessary mileage also protects driver hours on overnight schedules.
Dispatch communication tackles a different cause, since fewer avoidable ETA revisions mean fewer surprises for receivers. Driver training can target paperwork accuracy and damage prevention, while our vehicles are inspected regularly for safety and reliability, which supports the dependable equipment on-time performance depends on.
Connect Satisfaction to Money
Don't celebrate a higher survey score until you check whether service economics improved. The Deloitte Digital CX Study 2025 found that 96% of surveyed German companies measure customer satisfaction, yet only 20% successfully translate those measurements into quantifiable financial benefits. For a middle-mile provider, the practical question is which service variables most affect renewals, lane volume, and account profitability.
Track post-load CSAT beside repeat-lane rate, tender acceptance, exception recovery time, claims frequency, cost-to-serve, and customer lifetime value. Then compare satisfaction changes with matched lanes over time, so you don't mistake correlation for causation.
If you're a shipper or transportation planner, set up a 90-day baseline with Peak Transport on your overnight lanes this month. Pick the metric, name the owner on each side, and use the first review to fix one process with evidence behind it.
Peak Transport runs structured overnight box-truck lanes for distribution centers and regional hubs, with clear dispatch communication and documentation standards you can measure lane by lane. Visit Peak Transport to discuss a 90-day baseline for your middle-mile lanes and turn customer satisfaction metrics into specific operational fixes.