Fuel Consumption Tracking for Box-Truck Fleets: A Guide
Learn how to set up fuel consumption tracking for overnight box-truck fleets, with KPIs, data sources, validation steps and a worked ROI example.
November 1, 2026
Your monthly fuel report shows one blended MPG, but dispatch can't explain why otherwise identical box trucks on the same overnight lane return different results. One truck waited at a loading dock with its engine running. Another bought fuel before the reporting period ended but burned it afterward. The spreadsheet treats both differences as driver performance.
Fuel consumption tracking starts with reconciling those records, not ranking the trucks. For overnight middle-mile operations, useful numbers must account for scheduled lanes, loading waits, winter starts, and stop density. A clean dashboard isn't proof that the underlying records agree.
The Fuel Metrics Every Box-Truck Fleet Should Track
Fuel consumption tracking means recording fuel used against miles, vehicle identity, and operating context, not just adding invoices. Without those connections, you know what the fleet purchased, but not necessarily what each truck consumed.
Published ratings won't close that gap: the EPA's fuel-economy documentation explains that its estimates rely on standardized laboratory testing and adjustments for real-world conditions, so fleets still need to measure their own operating results. An overnight box truck's dock waits and winter starts belong in its operating record, not in an explanation invented after someone questions its MPG.
Core fuel KPIs for box-truck operations
| KPI | Formula | Unit | Use it for |
|---|---|---|---|
| Fuel economy | miles ÷ gallons | mpg | Comparing trucks on the same lane |
| Fuel intensity | gallons ÷ miles × 100 | gal per 100 mi | Comparing trucks of different sizes within appropriate operating groups |
| Cost per mile | total fuel spend ÷ miles | $ per mi | Budgeting and rate-per-mile pricing |
| Idle fuel share | idle gallons ÷ total gallons × 100 | % | Loading waits and overnight idling |
| Fuel per completed stop | gallons ÷ completed stops | gal per stop | Stop-dense routes |
| Data match rate | miles matched to fuel records ÷ total miles × 100 | % | Confidence in every other KPI |
Use the same measurement boundary for every numerator and denominator. If mileage covers a calendar month but gallons represent purchases made during that month, changes in tank inventory can distort the result. Use consistent full-to-full intervals for a manual check, or account for opening and closing fuel inventory.
Calculate fleet MPG from total verified miles divided by total verified gallons. Don't average individual truck MPG readings, because that gives lightly used trucks the same influence as heavily used ones.
Practical rule: A more precise formula won't rescue mismatched reporting periods.
Keep auxiliary fuel identifiable. Refrigeration units and power take-off loads shouldn't disappear into a driving-efficiency figure. When auxiliary equipment draws from the truck's tank, distinguish total vehicle consumption from propulsion consumption and label any allocation as an estimate.
This week, calculate MPG, fuel intensity, and cost per mile for a selected truck using last month's receipts and odometer readings. Attach a short unresolved-items list: missing receipt, questionable odometer, partial fill, or unexplained tank balance. That list is part of the result.
Connecting Fuel Cards, Telematics and ELD Data
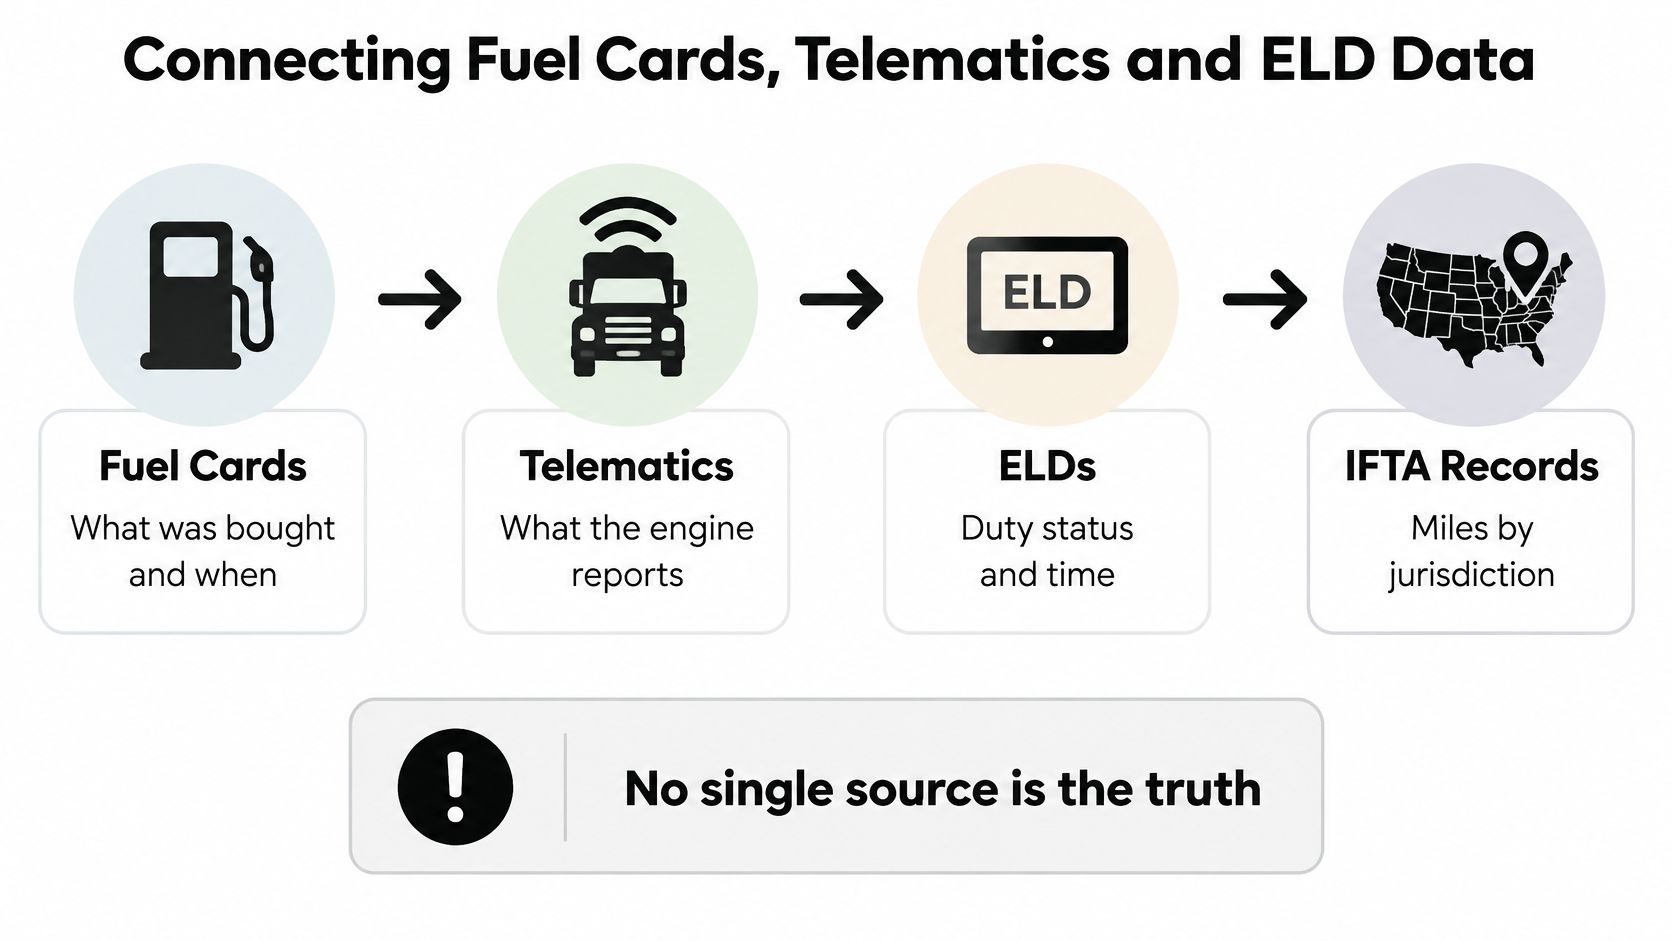
Start by deciding what each system can establish. No single source is the truth, and collecting more feeds doesn't eliminate the need to resolve disagreements.
Fuel data sources and their blind spots
| Source | What it records | Strength | Blind spot |
|---|---|---|---|
| Fuel cards | Date, station, gallons, cost, odometer, driver | Exact purchases and prices | Misassigned cards, partial fills, non-route fuel |
| Telematics or ECM | Engine-reported fuel use, miles, idle hours | Route-level detail | Sensor differences by engine make |
| ELD | Driving time, location, duty status | Hours-of-service context | Not a fuel measure on its own |
| IFTA records | Miles and fuel by jurisdiction | Tax-reconciliation reference | Quarterly summaries aren't nightly operating records |
| Maintenance system | Repairs, tank events, vehicle history | Explains outliers | Rarely linked to fuel by default |
The connections should preserve each record's origin.
Build a reconciled vehicle record
Use this workflow before publishing results:
- Assign a permanent vehicle identifier. Map cards and telematics devices to the truck, with effective dates when equipment changes vehicles.
- Capture transaction details. Keep date, time, station, fuel type, quantity, cost, odometer, and driver. For example, preserve the receipt when a driver corrects a mistyped mileage entry.
- Normalize units. Keep physical gallons for purchasing analysis and use energy-equivalent units when comparing fuels. The DOE Alternative Fuels Data Center uses gasoline-gallon equivalents to compare fuel energy across technologies.
- Reconcile distance. Compare odometer movement with ECM miles and applicable jurisdiction records. Check whether a discrepancy represents yard movement, a device outage, or a missing trip.
- Calculate operational measures. Produce fuel intensity and cost per mile for the matched interval, retaining the underlying transactions.
- Review exceptions before release. Assign an owner and resolution status rather than deleting troublesome records.
DOE's FleetDASH provides a useful model for transaction-level fuel processing, standardized energy units, and monthly consumption summaries. For teams designing the technical pipeline, PlotStudio AI's CDC and streaming integration compared offers context for choosing how updates move between systems.
Say a purchase appears against a truck with no matching route that night. Flag it as unmatched fuel, then check timestamps, card assignment, maintenance movements, and the adjacent shift before assuming misuse.
For refrigerated trucks, capture reefer hours and separately purchased reefer fuel. Keep cargo-cooling cost visible without presenting it as fuel burned moving the truck.
Compliance Records and Safety Checks to Keep
A fuel calculation should be reproducible from retained records. If accounting, dispatch, and compliance each hold a different version of the same transaction, an attractive report won't help someone reconstruct what happened.
For fleets subject to IFTA, compare jurisdiction mileage with the trip records supporting operational KPIs. A mismatch needs an explanation before filing, not a spreadsheet adjustment that makes the totals look convenient. Check reporting boundaries, omitted trips, vehicle eligibility, and distance-source differences.
Preserve evidence and corrections
Keep the original receipt and card transaction together, connected to vehicle identity, odometer, and driver. Neither replaces the other: the receipt helps establish the purchase details, while the card record connects it to the payment account.
Every correction needs an audit trail showing who changed it, when, and why. Preserve the original value, replacement value, and supporting evidence. If a vehicle assignment changes after reconciliation, make sure the revised record flows into both the operational report and the applicable compliance dataset.
Don't overwrite an inconvenient reading just because another system looks more plausible.
Safety records belong alongside the fuel history, but access should remain appropriate to each employee's role. Dispatch needs actionable exceptions; a fuel analyst doesn't automatically need unrestricted access to every driver record.
Check these retained records this week
- Purchase evidence: Receipts and card transactions remain retrievable by vehicle and reporting period.
- Vehicle and driver assignment: The record identifies who fueled which truck, including temporary substitutions.
- Distance support: Odometer, telematics, trip, and applicable jurisdiction records use documented reporting boundaries.
- Duty-status context: Relevant ELD records help explain trip timing and waiting without being treated as fuel measurements.
- Inspection and defect reports: Tire-pressure concerns, abnormal operating temperature, and idle complaints connect to a maintenance work order.
- Repair closure: Completion dates and mileage let maintenance compare operation before and after the repair.
- Correction history: Changed records retain their original values and an accountable reviewer.
A reported stuck thermostat or underinflated tire is a maintenance lead, not proof of the cause of poor MPG. Confirm the defect and record the repair before attributing a fuel change to it.
Confirm retention periods, filing responsibilities, and applicability with your compliance coordinator or accountant. Requirements differ by jurisdiction and fleet type, so don't apply a generic retention rule to every record.
How to Set a Fuel Baseline and Check Your Numbers
A universal MPG target can make a suitable truck look inefficient and an unsuitable comparison look persuasive. Build a baseline around comparable work, then investigate changes within that operating context.
Start with a vehicle-and-lane worksheet rather than a fleet leaderboard.
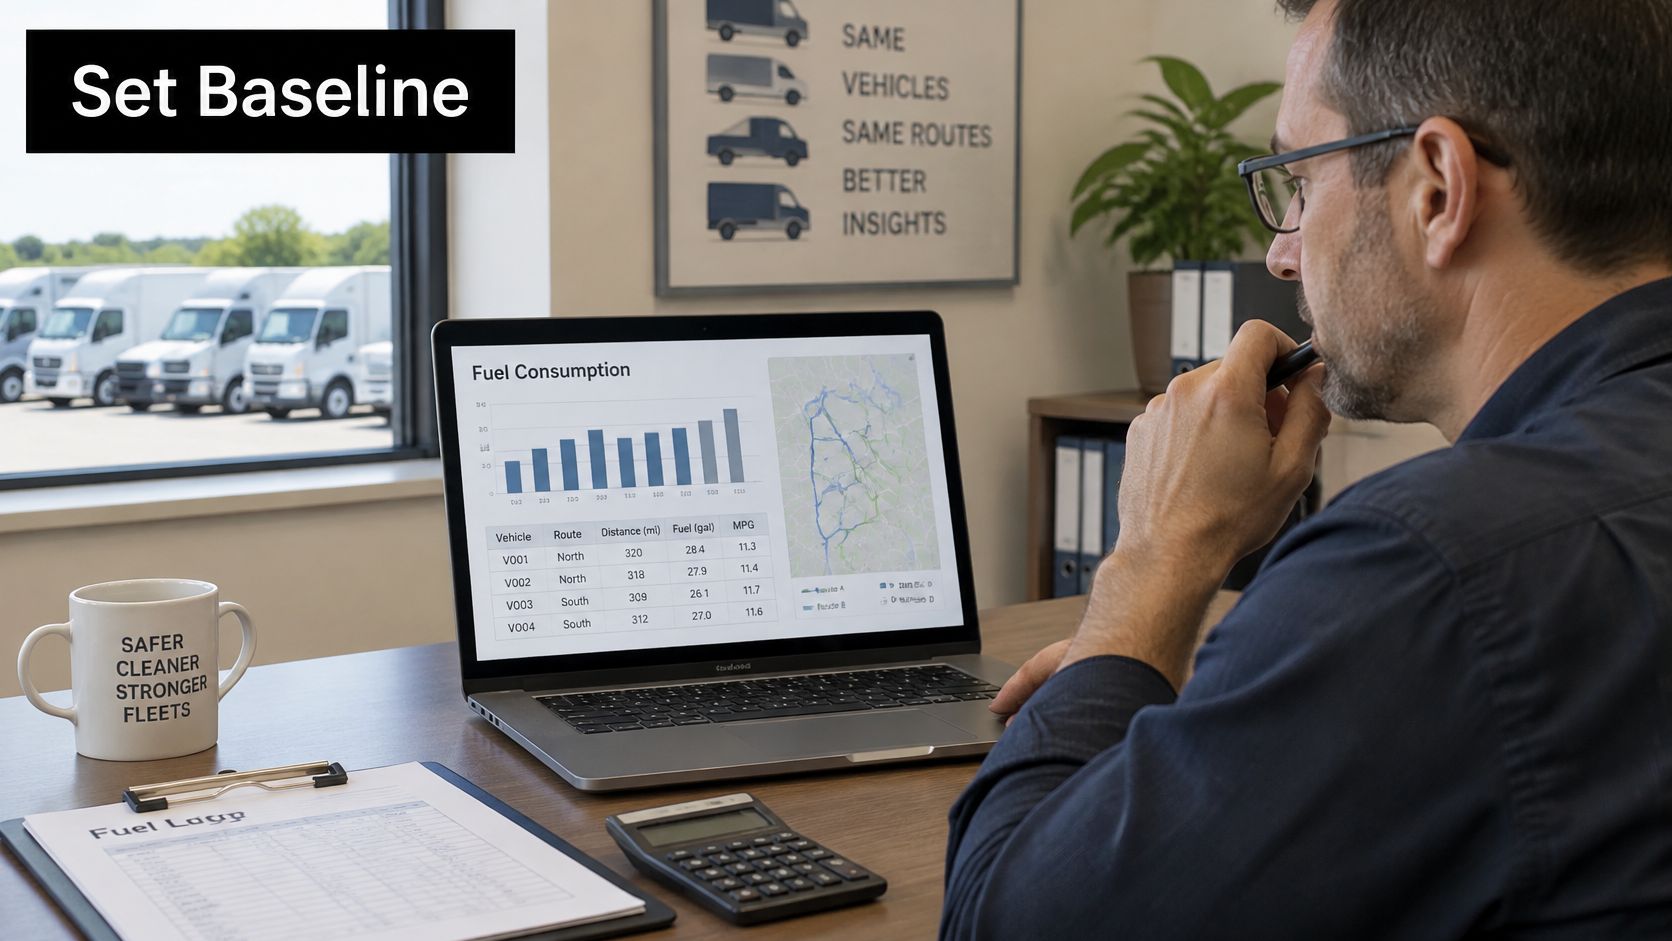
Establish comparable operating groups
The EPA SmartWay carrier methodology calls for 12 months of prior-year data for existing fleets and at least three months for newly formed fleets; a practical implementation is a three-month pilot on each stable lane, followed by these checks:
- Collect the pilot without chasing a target. Establish how the lane operates before changing dispatch instructions or introducing incentives.
- Label abnormal events. Separate major repairs, prolonged idling, severe weather, and diversions so an unusual operating period doesn't become the assumed normal.
- Calculate vehicle-day and lane fuel intensity. Use verified miles and gallons, and avoid assigning a purchase entirely to the day it occurred when it covers several shifts.
- Segment the comparisons. Group by truck specification, fuel type, payload, stop count, and shift. Keep winter operation distinguishable from milder conditions.
- Compare each truck with itself and suitable peers. A rolling baseline identifies deterioration; a matched peer group helps determine whether the whole lane changed.
- Investigate the weakest-performing group before prescribing a fix. Review the bottom decile as a diagnostic queue, not an automatic coaching list.
Don't remove difficult nights because they worsen the average. Preserve both the all-operation result and the labeled comparable-operation result, so management can distinguish normal efficiency from the actual cost of meeting service requirements.
Use the accompanying video as a discussion aid while reviewing the worksheet.
Check the denominators before the drivers
- Reporting-period errors: Fuel and distance must describe the same operating interval.
- Loaded and empty mileage: Identify both rather than allowing changing load mix to masquerade as improved efficiency.
- Undefined deadhead: State whether repositioning and return mileage belong to the lane.
- Short MPG dips: Check tank balance, weather, dock delays, and repairs before interpreting the movement as behavior.
Use monthly reconciliation as a management control, with transaction completeness, matched mileage, and unresolved exceptions attached to the results. Keep corrections and supporting evidence under the retention controls described for compliance records.
Dashboards and Monthly Reports Dispatch Will Use
A dashboard shows a clean MPG number, but nobody trusts it enough to make a decision. Dispatch remembers a missing trip; accounting remembers a card reassignment. Neither issue appears beside the chart.
Display data confidence next to performance. A 2025 fleet-management study identifies initial data quality and system integration as significant implementation hurdles, supporting the need for standardization before relying on analytics. A calculated value should carry a status such as provisional, reconciled, or awaiting investigation.
Give each team an actionable view
- Daily exceptions for dispatch: Show truck, scheduled lane, unmatched purchase or mileage, likely cause, owner, and status. Trigger review when a completed route has unmatched fuel activity or unexplained distance. A truck with no fuel purchase that night isn't automatically an exception if its tank balance supports the trip.
- Weekly lanes for planners: Show fuel intensity by scheduled route alongside transaction completeness, matched-mile share, and open exceptions. Trigger investigation when a lane's movement persists after adjusting for operating changes, rather than reacting to an isolated bad shift.
- Monthly management summary: Show cost per mile, idle fuel share, year-to-date consumption, and movement against each truck's approved baseline. Trigger review when performance moves outside a documented control band established from reconciled operating history.
Avoid arbitrary alert thresholds before you know how the records behave. A trigger should identify something a named employee can investigate, not generate a stream of notifications everyone learns to dismiss.
Sign off before publishing rankings
The monthly review should include dispatch, maintenance, accounting, and the person responsible for data quality. Resolve material exceptions, approve documented exclusions, and freeze a version of the dataset. Only signed-off records should update the baseline.
A provisional ranking is an investigation aid, not a basis for penalizing a driver.
When purchased gallons and engine-reported consumption disagree, show the discrepancy rather than choosing whichever produces a better result. Record whether the cause is known, estimated, or unresolved.
Our routes are scheduled between facilities and planned in advance, rather than built around random residential stops. That gives planners a defined lane structure for evaluating changes. Keep the fuel view aligned with broader transportation key performance indicators, so a lower fuel figure isn't celebrated alongside deteriorating service.
Build these views in the spreadsheet, reporting tool, or fleet platform you already use before buying another dashboard.
Driver Practices That Cut Fuel Without Unsafe Driving
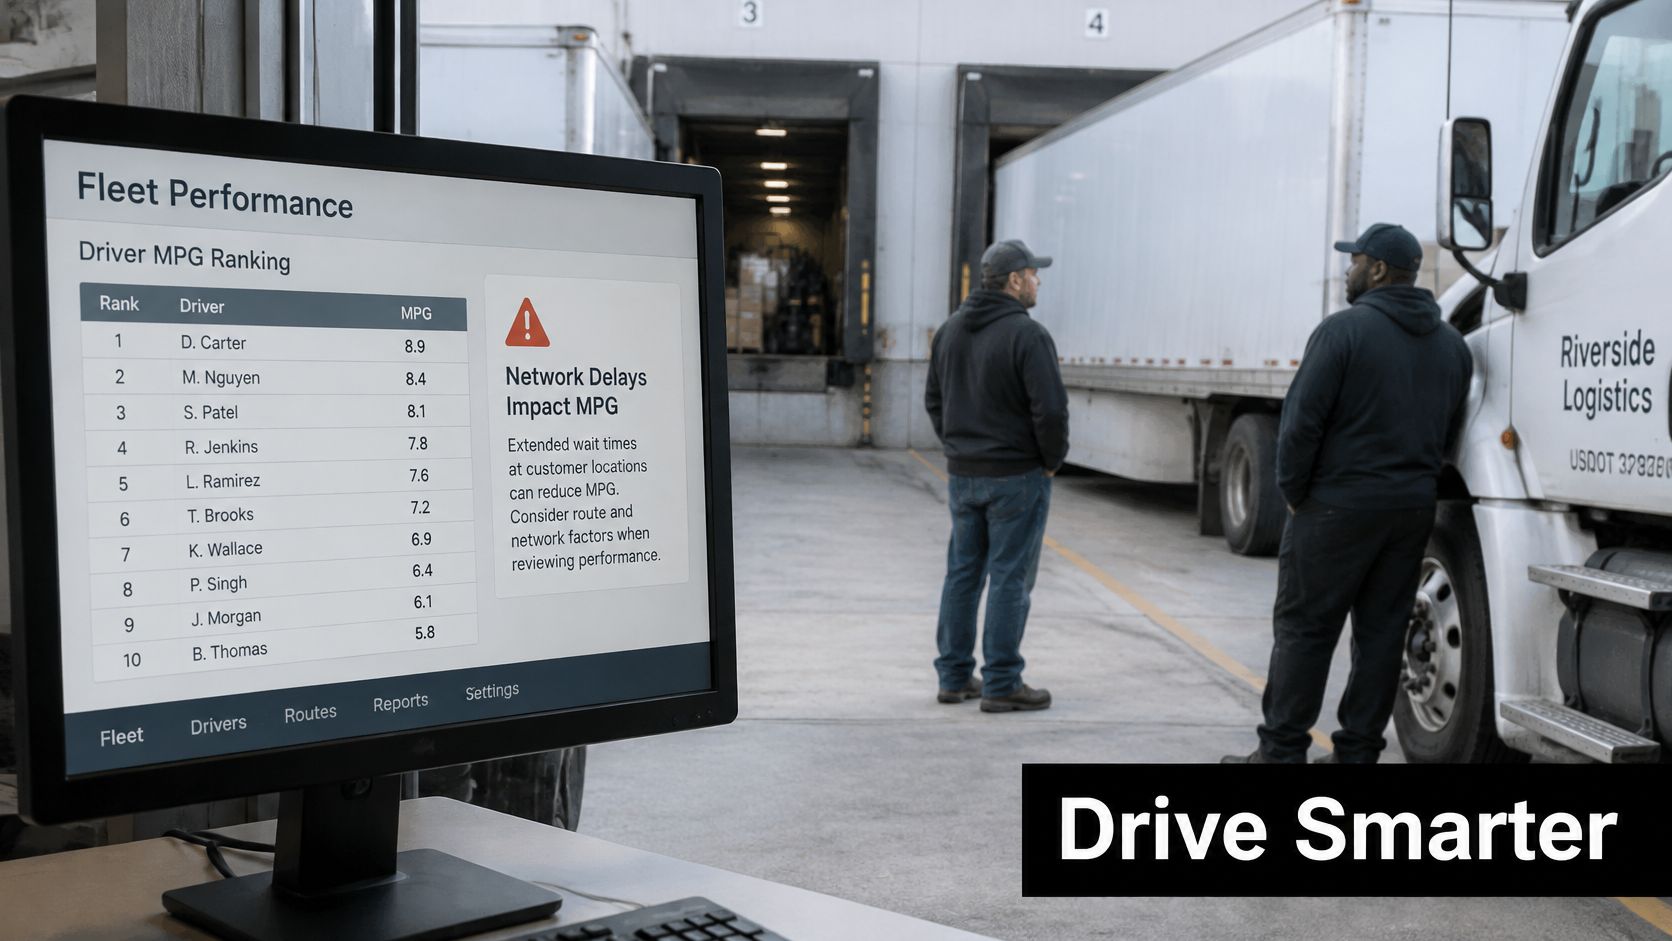
Say a dashboard ranks drivers by MPG, and the lowest-ranked drivers also handle the longest loading waits. Coaching them to accelerate differently won't fix a dispatch schedule that sends trucks to a closed dock.
Separate driver behavior from network design. A 2025 telematics review summarizes findings that aggressive driving can increase consumption by 10–40% under otherwise comparable conditions, with harsh braking also associated with inefficient energy use. Those comparable conditions matter: payload, congestion, weather, and appointment constraints can otherwise overwhelm the comparison.
Treat driver rankings as prompts for questions, not verdicts.
Coach what the driver can control
- Classify idle causes: Separate traffic, stationary dock waiting, necessary equipment operation, and avoidable unattended running. Don't apply the same remedy to every category.
- Use completed-stop context: Evaluate fuel per completed stop with payload and service requirements, so a changed stop pattern doesn't become a conduct issue.
- Teach smooth control: Coach progressive acceleration, anticipation, and safe following distance. Never reward recovering a late departure through higher speed.
- Connect inspections to maintenance: At Peak Transport, drivers load and unload with pallet jacks, document deliveries, and perform pre- and post-trip inspections. Use those reports to route tire-pressure and abnormal-idle concerns to maintenance.
A driver management system should help supervisors connect these observations with route and safety context, rather than just automate a leaderboard.
Hold lane-specific conversations
For the warehouse-to-hub lane, ask whether the planned departure consistently reaches the receiving dock before freight can be accepted. Dispatch should own the scheduling discussion.
For the winter-start lane, review the truck's approved cold-weather operating procedure with the driver and maintenance lead. Don't demand shutdowns that compromise visibility, safe operation, or equipment requirements.
For the stop-dense lane, review where repeated acceleration and braking occur and whether the stop sequence can change without disrupting appointments.
Hold these conversations this month with the people who can change the outcome. Shorter idle time isn't a win if it creates a missed appointment, unsafe working conditions, or pressure to exceed hours limits.
Calculate Your Savings and Start a Pilot Lane
Consider a hypothetical planning example, not a fuel-price quote or box-truck efficiency benchmark. Assume an overnight fleet has 20 trucks, each traveling 120 miles per night for 300 nights, averaging 10 mpg, with diesel budgeted at $3.60 per gallon.
Under those assumptions, annual distance is 720,000 miles, consumption is 72,000 gallons, and fuel spend is $259,200. The table applies illustrative reductions in gallons while holding mileage, fuel price, and service output constant.
Annual fuel savings for a 20-truck overnight fleet
| Scenario | Gallons used | Fuel spend | Savings |
|---|---|---|---|
| Baseline at 10 mpg | 72,000 | $259,200 | $0 |
| 3% reduction | 69,840 | $251,424 | $7,776 |
| 5% reduction | 68,400 | $246,240 | $12,960 |
| 8% reduction | 66,240 | $238,464 | $20,736 |
These are arithmetic scenarios, not promised outcomes. In particular, the 5% reduction is an assumption to test, not a benchmark that every fleet should expect.
Subtract the cost of obtaining the savings
Use net annual savings = avoided fuel spend − incremental implementation and operating costs. Include reconciliation labor at your actual loaded labor rate, telematics subscriptions attributable to the project, integration work, and any additional administration.
Separate efficiency savings from price savings. Lower spend caused by cheaper diesel doesn't demonstrate better vehicle performance. Likewise, fewer gallons caused by canceled routes don't demonstrate a more efficient operation.
Track the intervention itself. If planners change mileage while supervisors change idling practices, record both changes so management doesn't credit the same avoided fuel twice.
Our Route Optimization uses data modeling to reduce mileage and cut fuel consumption. The operational question behind route optimization benefits is whether you can remove unnecessary travel while preserving delivery windows, safe working time, and completed freight movement.
Make the pilot small enough to audit
Choose a stable overnight lane with clear dispatch ownership and accessible purchase records. Establish the baseline before setting a savings commitment, then select a specific intervention such as correcting an arrival-time mismatch or resolving a confirmed maintenance defect.
- Define success: Require lower verified consumption alongside acceptable on-time performance and safety.
- Name the owner: Give someone responsibility for unresolved records and another person authority to approve corrections.
- Set the expansion gate: Extend the method only when the lane's fuel, distance, and operating records reconcile.
Start with the three-month lane baseline, track the core fuel KPIs and data match rate, and document what changed during the trial. A defensible result from a manageable pilot is more useful than a fleetwide savings claim nobody can reproduce.
Peak Transport offers planned overnight middle-mile box-truck operations and data-modeled Route Optimization to reduce unnecessary mileage and fuel consumption. Visit Peak Transport to discuss your regional lanes, loading windows, and service requirements with a team that puts structured planning and safety first.