Performance Strategy Document: Key Components for 2026
Learn what a performance strategy document is, why it matters for logistics teams, and how to build one that drives results in 2026.
October 15, 2026
At 21:30 on a Tuesday, an overnight box-truck operation can look controlled right up until three decisions collide. One route is late, an ELD warning shows the driver's remaining hours narrowing, and a customer wants a dependable arrival update. Without a written performance strategy document, the dispatcher is forced to improvise. One person protects the customer promise, another protects utilization, and the driver receives the pressure from both directions.
A useful document removes that ambiguity. It connects the operating philosophy to measurable outcomes, assigns each measure to an owner, defines when people review it, and sets the action that follows a miss. For an overnight fleet, it also makes safety and legal operating capacity constraints inside the plan, not footnotes added after an incident.
Why a Performance Strategy Document Matters on a Tuesday Night
The strongest performance strategy document works as an operating contract. It tells dispatchers what reliability means, tells supervisors which evidence to review, tells drivers which expectations are realistic, and tells leadership when a local decision requires escalation. It isn't a binder that gets presented once and then forgotten. It's the shared rulebook for making trade-offs under pressure.
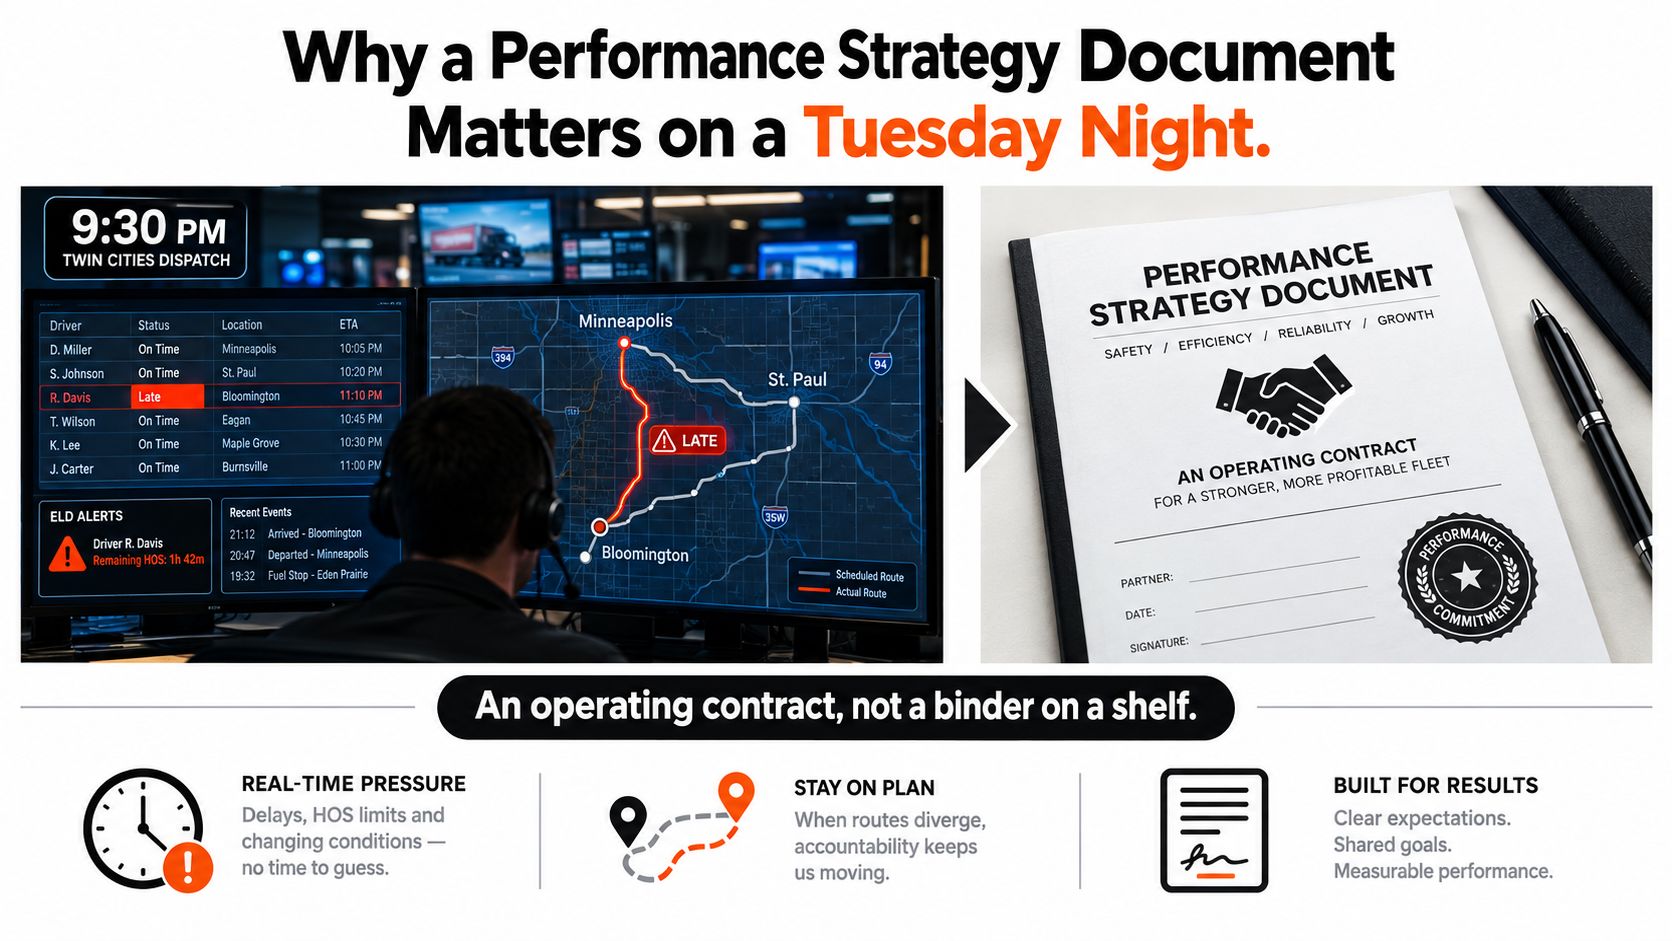
Consider the late route. If the document only says “improve on-time performance,” the dispatcher has no agreed method for deciding whether to reroute, notify the customer, hold the driver, or protect the remaining hours. If the document defines the arrival timestamp, identifies the data owner, sets an escalation threshold, and prohibits a recovery plan that consumes the safety margin, the decision becomes repeatable.
Practical rule: If two competent supervisors can read the same KPI and reach different conclusions, the document isn't finished.
Strategic planning has a measurable connection to organizational performance. A meta-analysis reviewed 87 correlations from 31 empirical studies and found that strategic planning had a positive, moderate, statistically significant effect across private and public organizations and across U.S. and non-U.S. settings. The relationship was strongest when organizations measured effectiveness and used formal rather than informal planning. The meta-analysis supports a practical conclusion: documenting goals, execution plans, responsibilities, review intervals, and corrective actions gives strategy a better chance of changing results.
For Peak Transport, that means connecting reliable overnight execution and safety-first operations to indicators such as departure performance, arrival performance, route completion, vehicle availability, documentation accuracy, and driver-hours compliance. The document turns those priorities into a system people can operate on a difficult Tuesday night.
The Four Perspectives That Anchor a Modern Performance Strategy
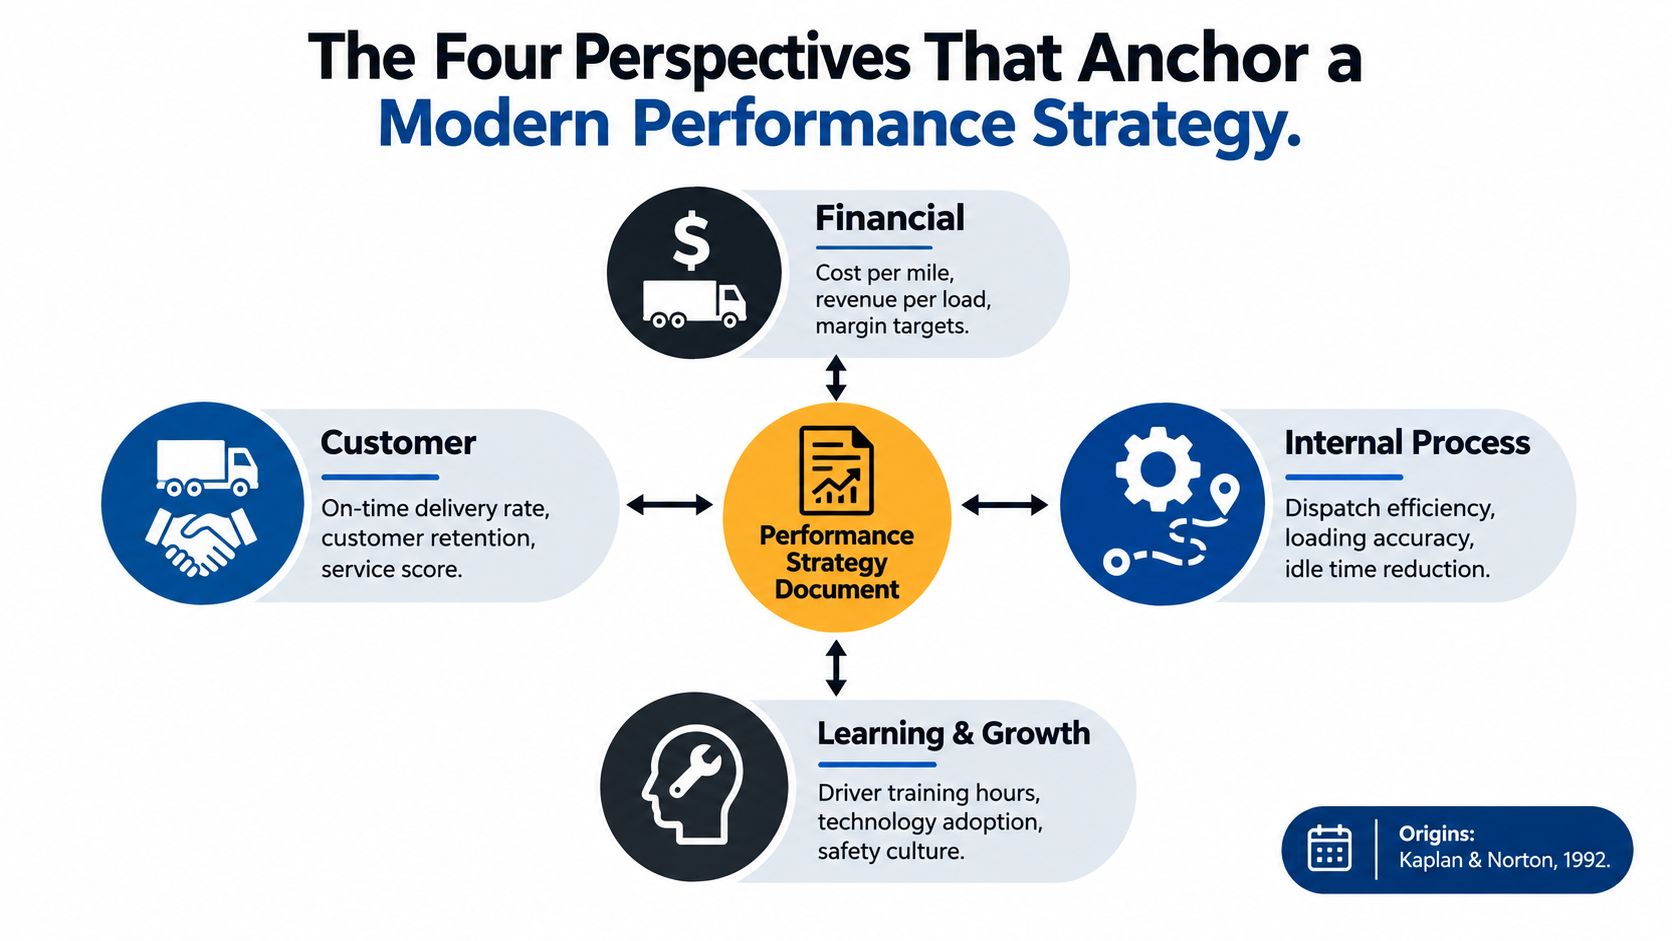
A modern performance strategy document needs more than a financial target and an on-time percentage. The Balanced Scorecard, introduced by Robert S. Kaplan and David P. Norton in a January–February 1992 Harvard Business Review article, combined financial outcomes with customer satisfaction, internal business processes, and organizational learning and improvement. Their research followed a year-long project involving 12 companies developing broader performance-measurement systems. The original framework remains useful because it prevents leadership from treating one outcome as the whole strategy.
Financial and customer outcomes
The financial perspective asks whether the operating model creates acceptable economic value. In middle-mile transportation, that may include revenue per route, cost per completed movement, cost per loaded mile, and margin discipline. These are lagging measures. They tell leadership what the operation produced, but not necessarily why.
The customer perspective defines whether the service meets the promise. Service reliability, exception rates, communication quality, and predictable handoffs belong here. A customer doesn't experience “utilization.” The customer experiences whether freight arrives at the expected time, in the expected quantity, and in the expected condition.
Internal process and learning
The internal-process perspective exposes the controllable work behind those outcomes. Dispatch accuracy, route adherence, loading quality, scan compliance, dwell management, equipment readiness, and exception response give supervisors levers they can use during the shift.
The learning-and-growth perspective protects the operation's future capability. Training completion, safety coaching, driver qualification, retention, technology adoption, and quality of feedback show whether the fleet can improve without relying on individual heroics.
A useful document maps every KPI to one perspective and links each lagging outcome to a leading driver. Leaders who need to coordinate technology, operating controls, and responsible adoption may also find a fractional CAIO useful when their performance system includes automation or AI governance.
The KPI Architecture Behind a Useful Performance Strategy Document
A flat KPI list creates the appearance of control without giving anyone a diagnostic path. The ASCM SCOR Digital Standard organizes supply-chain performance around reliability, responsiveness, agility, cost, asset management, environmental performance, and social performance. It distinguishes strategic Level 1 measures from progressively more diagnostic lower-level measures and identifies more than 300 available metrics. The SCOR Digital Standard is valuable precisely because it encourages structure instead of dashboard accumulation.
For a middle-mile carrier, the executive scorecard should stay small. A practical Peak Transport architecture can use seven executive KPIs: on-time departure, on-time arrival, tender acceptance, route completion, empty-mile percentage, cost per loaded mile, and safety-event rate. Each one needs a driver layer that explains movement.
SCOR's definition of reliability is especially important. It concerns predictable delivery at the expected time, quantity, and quality. That wording keeps customer commitments outcome-based while allowing supervisors to manage the upstream causes, such as dispatch release variance, facility dwell, loading delay, route deviation, traffic exposure, and HOS interruption.
For teams building scorecards outside logistics, a resource on how to find software development KPIs offers a useful parallel: the measure matters only when it connects to decisions and accountability. The same principle applies to fleet operations. Peak Transport's logistics performance metrics can sit alongside the formal scorecard, provided each metric has a defined role.
| Executive KPI | Diagnostic Drivers | Owner | Frequency |
|---|---|---|---|
| On-time departure | Dispatch release variance, loading completion, documentation readiness | Dispatcher supervisor | Each shift and weekly review |
| On-time arrival | Dwell duration, route adherence, traffic exposure, HOS interruption | Operations manager | Each movement and weekly review |
| Tender acceptance | Capacity availability, lane feasibility, equipment readiness | Operations manager | Each tender and monthly review |
| Route completion | Missed stops, recovery intervention, vehicle availability | Dispatcher supervisor | Each route and weekly review |
| Empty-mile percentage | Positioning, reload planning, route design | Operations manager | Weekly |
| Cost per loaded mile | Loaded miles, fuel use, labor allocation, recovery activity | Operations manager | Monthly |
| Safety-event rate | Preventable incidents, near misses, inspection findings, fatigue concerns | Director | Weekly exceptions and monthly review |
The executive layer tells leadership whether the strategy is working. The diagnostic layer tells the shift team what to change.
How to Write a Single KPI So It Actually Drives Behavior
A KPI becomes useful only after its definition removes room for argument. Before adding a chart, write a one-page KPI card that specifies what counts, who supplies the data, and what happens when the result moves outside tolerance.
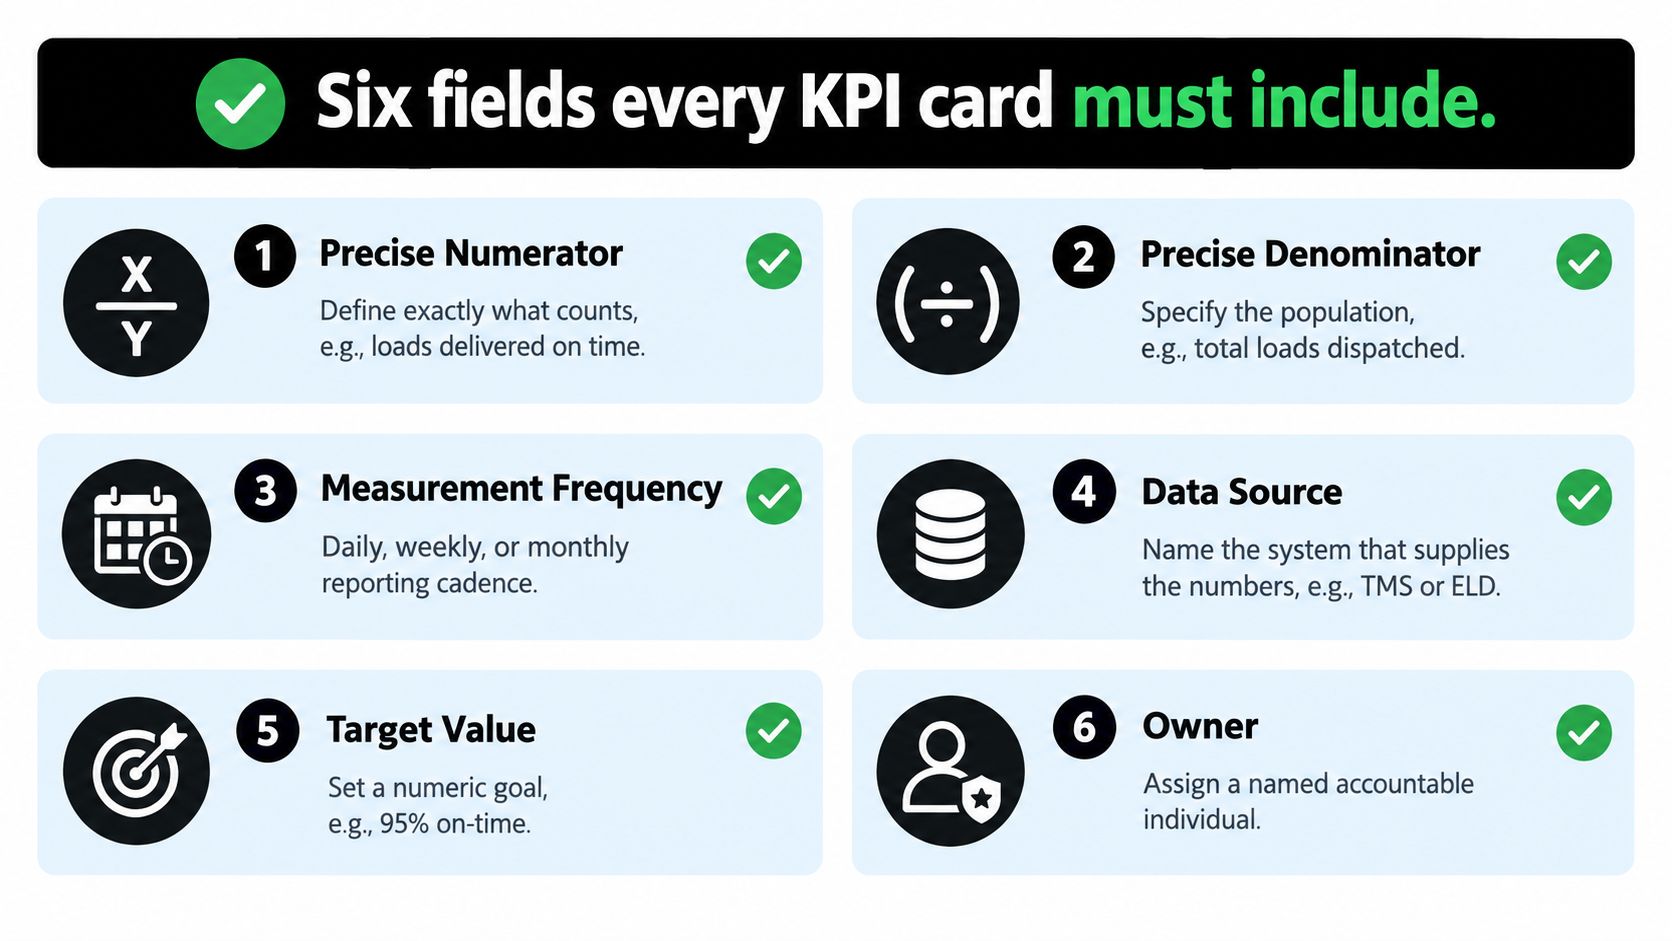
Use six fields as the minimum:
- Numerator and denominator: State the calculation precisely. For on-time arrival, the numerator might be eligible movements arriving within the defined service window. The denominator must identify the eligible movement population.
- Event timestamp: Decide whether the clock stops at facility arrival, facility departure, or final handoff. “On time” has no operational meaning until the event is named.
- Data owner: Assign one person or role to validate the source, resolve exceptions, and approve corrections.
- Reporting frequency: Specify whether the team reviews the measure per movement, per shift, weekly, or monthly.
- Target and tolerance band: Set the expected result and the range that prompts attention. A target without a tolerance band encourages arguments over whether a small miss matters.
- Corrective-action trigger: Define the response, owner, due date, and verification method when performance crosses the threshold.
Take on-time arrival. If dispatch counts arrival at the destination facility but the customer counts completed handoff, both teams can report “on time” while describing different events. Waiting time, shipper-caused delays, and approved exceptions also need explicit treatment, or the metric will punish people for conditions they couldn't control.
A KPI card is the atomic unit of a performance strategy document. One precise card is worth more than another attractive dashboard tile.
The card should include the source system, such as the TMS, ELD records, facility scan data, or an approved exception log. It should also identify whether a corrected record requires supervisor approval. That small control protects trust. Drivers and dispatchers are more likely to use a scorecard when they can see that the organization distinguishes an operational failure from a bad timestamp or an external delay.
Leading Versus Lagging Indicators and Why Fewer Metrics Win
A dashboard with dozens of measures can conceal a lack of priorities. The better question is whether the team has enough information to make the next decision safely and consistently.
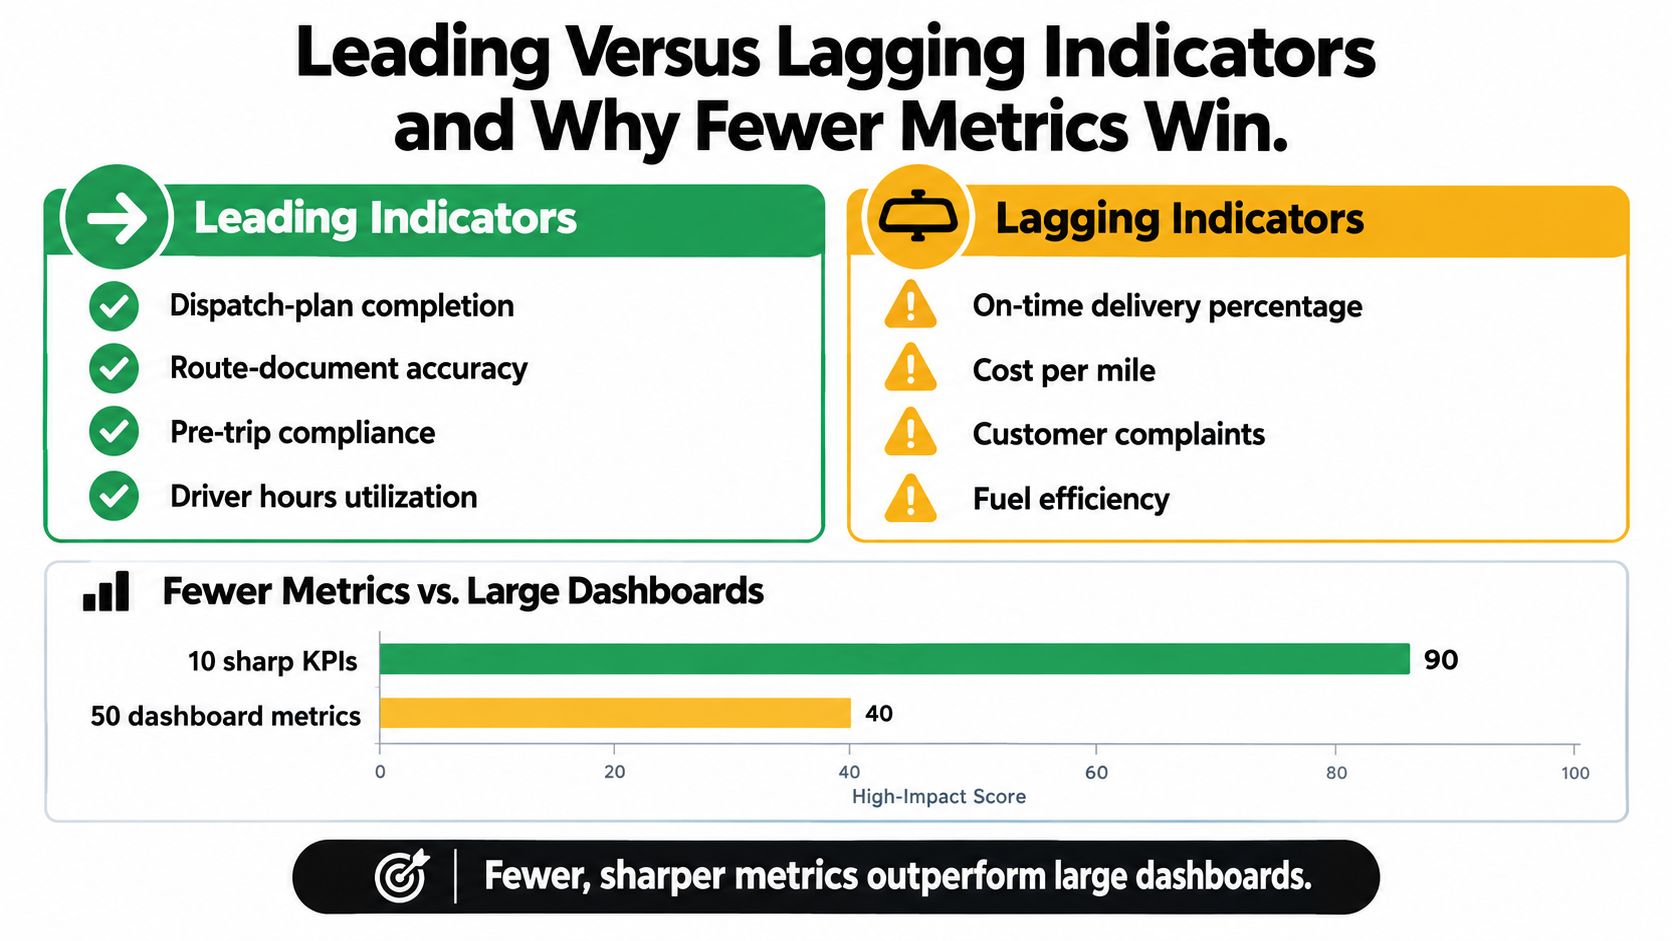
Leading indicators show whether the work that produces a result is happening. For an overnight fleet, these include dispatch-plan completion, route-document accuracy, pre-trip compliance, and dwell-risk alerts. Lagging indicators confirm the result after the movement: on-time arrival, preventable incidents, claims, and turnover.
The U.S. Office of Personnel Management recommends combining leading and lagging indicators and using both quantitative and qualitative measures. In practice, a supervisor can pair a route-document accuracy check with on-time arrival, then add a short exception note explaining whether a miss came from facility congestion, equipment readiness, or planning quality.
A strong objective usually needs a small pair of measures, not a crowded cluster. For example:
- Reliable departure: Use dispatch-plan completion as the leading indicator and on-time departure as the lagging indicator.
- Safe execution: Use pre-trip compliance and fatigue concern reporting as leading signals, then review preventable incidents and HOS exceptions as outcomes.
- Controlled cost: Use route-plan adherence as a leading signal and cost per loaded mile as the financial result.
- Customer confidence: Use exception-notification timeliness as a leading signal and service complaints or claims as lagging evidence.
A metric that doesn't change a decision doesn't belong on the executive page. It may remain in the diagnostic layer if a supervisor uses it to investigate a specific failure, but it shouldn't compete with measures that govern the operation.
Safety Guardrails That Keep Productivity Targets Honest
An overnight route can be technically complete and still be a poor operating decision if the schedule consumes the driver's legal or practical recovery margin. A performance strategy document must place HOS inside route planning, not in a separate compliance appendix.
FMCSA states that hours-of-service rules establish maximum driving and on-duty limits along with required rest periods, and that commercial motor vehicle carriers and drivers generally must comply with 49 CFR Part 395, subject to specified exceptions. FMCSA's ELD framework also establishes minimum performance and design requirements for electronic logging devices. FMCSA safety guidance also places responsibility on the motor carrier to verify that its ELD is registered.
The pre-dispatch feasibility check
Every planned lane should pass a feasibility review before release. At minimum, the calculation should include:
- Scheduled driving time
- Loading and unloading dwell
- Fueling and inspection
- Anticipated congestion
- Weather buffer
- Legally available driver hours
The document should assign ownership for ELD registration, data review, exception investigation, and record retention. It should also track projected HOS margin at dispatch, hours remaining at checkpoints, unplanned stop duration, log-edit exceptions, and trips requiring recovery intervention.
The escalation rule should be explicit: dispatch review starts when projected arrival would consume the defined safety buffer or when remaining legal hours fall below the route's modeled completion requirement. A supervisor can then re-sequence work, notify the customer, arrange recovery, or stop the plan before pressure reaches the driver.
The risk isn't theoretical. FMCSA launched a 2025 research effort to collect ELD, crash, inspection, and schedule data because existing evidence is insufficient to determine how alternative schedules affect fatigue, crash risk, and driver performance. In 2025 roadside-inspection data, HOS violations represented 32.4% of all driver out-of-service violations in the United States, Canada, and Mexico, while false duty-status reporting produced 6,823 driver violations nationwide as of August 29, 2025. FMCSA's Federal Register notice makes the strategic lesson clear: leadership shouldn't assume that faster routes or higher utilization are automatically safer or more profitable.
Governance Cadence That Makes the Document a Living System
A performance strategy document needs a meeting rhythm that matches the decisions people make. The cadence should be frequent enough to correct operational problems and deliberate enough to avoid changing definitions every time a result disappoints.
Weekly operational review
The dispatcher supervisor owns the weekly review of the diagnostic layer. The meeting examines route misses, dwell patterns, dispatch release variance, documentation errors, HOS alerts, equipment issues, and open corrective actions. Each exception should record the event, likely cause, accountable owner, due date, and verification step.
Monthly governance board
The operations manager brings the executive scorecard to a monthly governance board. Leadership reviews trends, accepts or rejects escalations, confirms whether corrective actions addressed root causes, and checks whether a KPI is still helping people make decisions. This is also the right forum to examine whether customer-caused delays and approved exceptions are being treated consistently.
Quarterly strategy reset
The director leads a quarterly review of objectives, targets, guardrails, and resource priorities. The group can retire a measure, revise a target, add a diagnostic, or change ownership, but every change needs a written rationale. The Peak Transport performance benchmarking resource can support that conversation when leaders compare operating results against an agreed reference point.
Technology changes deserve the same governance discipline as operational changes. Teams introducing automated decision support should define how they manage AI compliance and risk, especially when a system influences dispatch, employee evaluation, or customer communication.
Maintain two logs. The exceptions log explains each miss and its corrective path. The change log records every revision to scope, definition, target, owner, or review cadence. Without both, the document drifts while retaining the appearance of authority.
The Template Outline You Can Lift Into Your Own Strategy
Supply chain and operations leaders can build a working performance strategy document from the following sequence. Each section should answer a practical question and include an example that a dispatcher or supervisor can use.
- Mission and operating philosophy: State what the operation promises and what it will never trade away. Example: reliable overnight middle-mile execution with safety and legal operating capacity protected.
- Strategic objectives: Convert the mission into a short set of objectives. Example: improve predictable arrival while reducing avoidable route variation.
- KPI scorecard with definitions: List the executive measures and their full KPI cards. Example: on-time arrival is tied to a named event timestamp, eligible movements, owner, target, tolerance, and trigger.
- Diagnostic-driver map: Show which process variables explain each executive result. Example: an arrival miss connects to dwell duration, loading delay, route deviation, and HOS interruption.
- Safety and HOS guardrails: Document the pre-dispatch feasibility check and no-dispatch conditions. Example: dispatch review begins when projected arrival consumes the defined safety buffer.
- Governance cadence: Assign the weekly, monthly, and quarterly forums. Example: the dispatcher supervisor owns weekly diagnostics while the operations manager owns monthly scorecard decisions.
- Roles and responsibilities: Name the owner for every metric, source, exception, and approval. Example: the operations manager validates cost-per-loaded-mile reporting.
- Exception and corrective-action workflow: Define how teams classify, assign, resolve, and verify misses. Example: every unresolved exception receives an owner and due date before the review closes.
- Change log: Record revisions to definitions, targets, scope, and ownership. Example: a revised arrival timestamp includes the reason and effective date.
- Review schedule: Publish the calendar and required inputs. Example: the quarterly review includes trend analysis, open actions, target proposals, and retired metrics.
The outline is deliberately plain. A document that dispatchers can use during a late route is more valuable than a polished strategy manual that only executives understand.
Version Control and Revision Discipline for Long-Term Credibility
The first draft earns attention. The revision history earns trust.
Give every version a number, effective date, named author, named approver, and summary of changes. Keep the previous version available so a supervisor can determine whether a result changed because operations changed or because the organization changed the definition.
The change log should answer four questions:
- What changed? Record the exact KPI, target, owner, scope, or workflow revision.
- Why did it change? Tie the revision to an operational problem, regulatory need, customer requirement, or strategic shift.
- Who approved it? Identify the accountable decision-maker.
- When does it apply? State the effective date and any transition period.
Scope creep needs a hard test. Every proposed metric should identify which executive KPI it supports and which diagnostic gap it closes. If the requester can't answer those questions, the addition belongs in a working analysis, not the governing scorecard.
Use the quarterly strategy reset to retire measures that no longer change decisions. Keep a clear record of why they were removed. Teams responsible for operational records can use documentation best practices to support consistent naming, retention, approvals, and access.
A performance strategy document gains authority because people maintain it. The change log makes the next review legitimate, since everyone can see how the current operating rules came to exist.
One-Page Executive Summary to Anchor Your Own Document
Purpose: Deliver reliable overnight middle-mile execution while protecting safety, legal hours, and clear accountability.
Executive KPIs: On-time departure, on-time arrival, tender acceptance, route completion, empty-mile percentage, cost per loaded mile, and safety-event rate. Each KPI requires a defined numerator, denominator, event timestamp, owner, source, reporting frequency, target, tolerance band, and corrective-action trigger.
Governance: The dispatcher supervisor reviews diagnostic drivers weekly. The operations manager reviews the executive scorecard monthly. The director resets objectives, targets, and priorities quarterly.
Safety rule: Dispatch review is mandatory when projected arrival consumes the defined safety buffer or remaining legal hours fall below the route's modeled completion requirement.
Control: Record every exception with an owner, due date, corrective action, and verification step. Record every definition or target revision in the change log.
That one page gives executives, dispatchers, and drivers a common operating reference. The first version is only the starting point. The change log will quickly become the most useful part of the document because it shows how the operation learns.
Peak Transport provides structured middle-mile execution for brands that need dependable overnight box-truck routes, documented dispatch controls, and safety-conscious performance management. Visit Peak Transport to discuss a logistics partnership or explore W-2 overnight driving opportunities in the Twin Cities.